To close the day, I'll end with something I don't often cover. With the indexes as high as they are..and the VIX..as low as it is, lets take a look at the SPY/VIX ratio. The following are a very strange type of chart, I like to call them the 'zig-zag rainbow' style of charts. They make use of the Elder impulse system, I think the coloured candles are especially useful!
SPY/VIX, 1yr, near term
Here is something to consider, if you didn't know anything else right
now about the market, you'd surely say that this wedge is going to break to the downside,
right? Whether you want to call it a wave'3, or whatever, the default reaction would be a move to the downside.
SPY/VIX, 10yr
The ten year chart gives a particularly stunning and clear overview of the crazy path from whence we came! Is it really a giant H/S formation for this market, as seen from this SPY/VIX chart?
One thing that any decent doomster/long term economic fundamentalist bear, needs to look for in the months ahead, a break under that blue line, the neckline. If I see a break under that later this year, we'll 'know' the 3.5 year 'rally of delusion' is finally over.
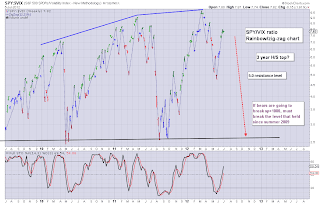
SPY/VIX, 3yr, outlook
I found it particularly interesting last month that we bounced just a touch under the 5.0 level in the previous down cycle. You can see in this chart that we'll usually get stuck around the 5.0 level - regardless of whether the trend is up..or down.
The current SPY/VIX up move is certainly a very strong one, and we're really not far off from breaking new highs. Bears will need to see a break under 4.7 in the weeks and months ahead for our first attempt to break the 2.5 neckline
Summary
So..what to make of those 3 kooky charts? With the SP' closing marginally lower today, and the VIX sitting at a lowly 17.50, what now?
I don't think this market is going to trade sideways this summer -as increasingly a lot of people seem to be saying. I am inherently biased of course, but does anyone out there really think sp'1266 was the low for the year? Seriously? With all the economic problems out there, no way do I see new lows not being attained in the months ahead.
I remain pretty confident we'll at least make a move lower to sp'1225/00 in the next month or so, but the key issue is whether we can break much lower..into the low 1100s....bounce for a few months..and then...collapse away.
Sp, monthly, scenarios
My best guess remains 'B', as in B for Ben.....and B for Bernanke ;)
--
As for Friday...I will hope that it will at least be somewhat entertaining. My jobs guess +30/35k, although I fear the market might easily ramp on 'hopes of further QE'. The 60min index cycles are certainly ready for a 4-6 hour up cycle. Anyway, we'll soon know.
Goodnight from the city of the Shard.


