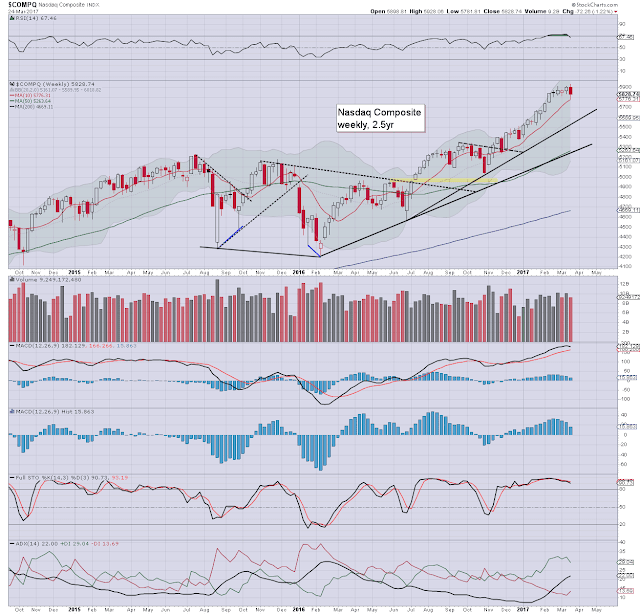
It was a bearish week for US equities, with net weekly declines ranging from -2.6% (R2K), -1.5% (Dow, NYSE comp'), to -1.2% (Nasdaq comp'). Near term outlook offers renewed upside into April earnings, at least to the sp'2425/50 zone. The French election will be a clear threat to the US and other world markets, but should be brief like the BREXIT event.
Lets take our regular look at six of the main US indexes
sp'500
The sp' saw a net weekly decline of -34pts (1.4%) to 2343 (intra week low 2335). Its notable we still saw a weekly close above the key 10MA, which has broadly held since early Nov'. Underlying MACD (blue bar histogram) ticked lower for a third consecutive week. There is a threat of a bearish cross into month end.
Best guess: the 50dma - in the low 2330s, should hold across next week. Renewed upside into end month and across at least the first half of April. By mid April, the market should be pushing for new historic highs >2400, with 2425/50 by late April/early May.
Equity bears have nothing to tout unless we break mid term rising trend, which at end April, will be around 2260.
--
Nasdaq comp;
The tech - which has been leading the way higher, was the most resilient index this week, settling -1.2% at 5828. However, it was VERY notable that the equity bulls managed a new historic high on Tuesday of 5928. The bulls can tolerate another 3-4% lower before any problems.
Dow
The mighty Dow declined -317pts (1.5%) to 20596. Indeed, most should recognise how the giant psy' level of 20k is now first soft support. That looks set to hold in the near term, before another wave higher to the 21300/500 zone.
NYSE comp'
The master index settled -1.5% at 11418, the first close under the weekly 10MA since late Oct'. However, things only turn bearish if rising trend from the Feb'2016 low is broken. By late April, that will be around 11200. First big target is the 12k threshold which seems viable as early as June.
R2K
The second market leader saw the biggest decline this week, -36pts (2.6%) to 1354. There are multiple aspects of support within the 1320/00 zone. It seems extremely unlikely that the R2K will see any price action <1300 in the near term. Instead, renewed upside to new historic highs within the 1425/50 zone. The 1500s look a stretch though, before a broader market retrace.
Trans
The 'old leader' - Trans, declined for a third consecutive week, settling -2.4% at 8928, back to levels from mid November. Indeed, the tranny is struggling, at levels equivalent to sp'2100. Lower bollinger will be offering strong support in the 8800s next week, and that should hold. Its notable that underlying MACD cycle has now been outright bearish for a third week. Cyclically, we're on the low end. Trans to 10k seems a valid target this summer.
--
Summary
The most bearish week for most US equities since late Oct'2016
All indexes remain relatively close to recent historic highs. It is notable that the Nasdaq comp' broke a new historic high on Tuesday.
There remains around 5% of downside buffer before the mid term trends - from the early 2016 lows, are at risk of being broken.
--
Looking ahead
It will be the run into end month, and for the chartists out there, the monthly closes are especially important.
M -
T - intl' trade, Case-Shiller HPI, consumer con', Richmond fed
W - pending home sales, EIA Pet' report
T - weekly jobs, Q1 GDP (3rd estimate), corp' profits, EIA Nat' gas
F - pers' income/outlays, Chicago PMI, consumer sent'
*there are a truckload of fed officials on the loose, notably Bullard on Friday.
**UK/EU clocks jump ahead 1hr in the early hours of Sunday, bringing back the standard 5hr difference to EST. Yours truly will be especially pleased about that.
--
Special note - the French election
With the healthcare bill out of the way (at least for a while!) the next big event is the French presidential election. Round one is due Sunday April 23rd. If no clear winner, then it will drag out to round two - Sunday May 7th.
For the curious: https://en.wikipedia.org/wiki/French_presidential_election,_2017
Its fascinating that the French equity market is now at key multi-decade declining trend/resistance.
CAC, monthly, 20yr
A major failure or breakout is due. Those hyper-bulls seeking broad upside across 2017, are going to need to see the French market break up and away.
--
Follow me on twitter: https://twitter.com/permabear_uk, where I am trying to provide some extra charts of interest each evening. If you retweet any of my tweets, a trader gets their wings.
--
Have a good weekend
--
*the next post on this page will likely appear Monday at 7pm EST


