Lets take a look at six of the main US equity indexes
sp'500

The sp'500 saw gains of almost 1.4% this week. Underlying MACD (blue bar histogram) cycle ticked lower for a fifth week. In terms of the cycle, it looks like there is no more than 2 weeks left of the current down wave.
Primary target for the bears should remain the lower weekly bollinger, which at the Monday open will likely jump to around 1585. A hit of the June 1560 low looks overly difficult, even if the market is spooked by any US/Syria issues.
When the current down cycle does complete, what will obviously be critically important - for bulls and bears alike, is whether the market can break above 1709. If the bears can keep the market pinned under 1709 into mid-October, then things could get rather interesting.
Nasdaq Comp'

The tech climbed 2% this week, and closed back about the important weekly 10MA. The bears should recognise that the Nasdaq is a mere 1% from breaking new highs - equivalent to sp'1695 or so. Despite the equity gains, underlying MACD cycle ticked lower for a fifth week.
Dow

The mighty Dow remains the weakest index, and clawed a mere 0.8% higher. Underlying MACD cycle ticked lower for a fifth week, and on any basis, we're getting close to a cyclical low. It is going to be very difficult for the bears to break the Dow under 14500/400. I'm guessing, the Dow will indeed hold key mid-term support.
NYSE Comp'

The master index gained 1.8%, but perhaps importantly, put in the second weekly close below the 10MA. Best case downside looks to be around 9000, that is around 5% lower.
R2K
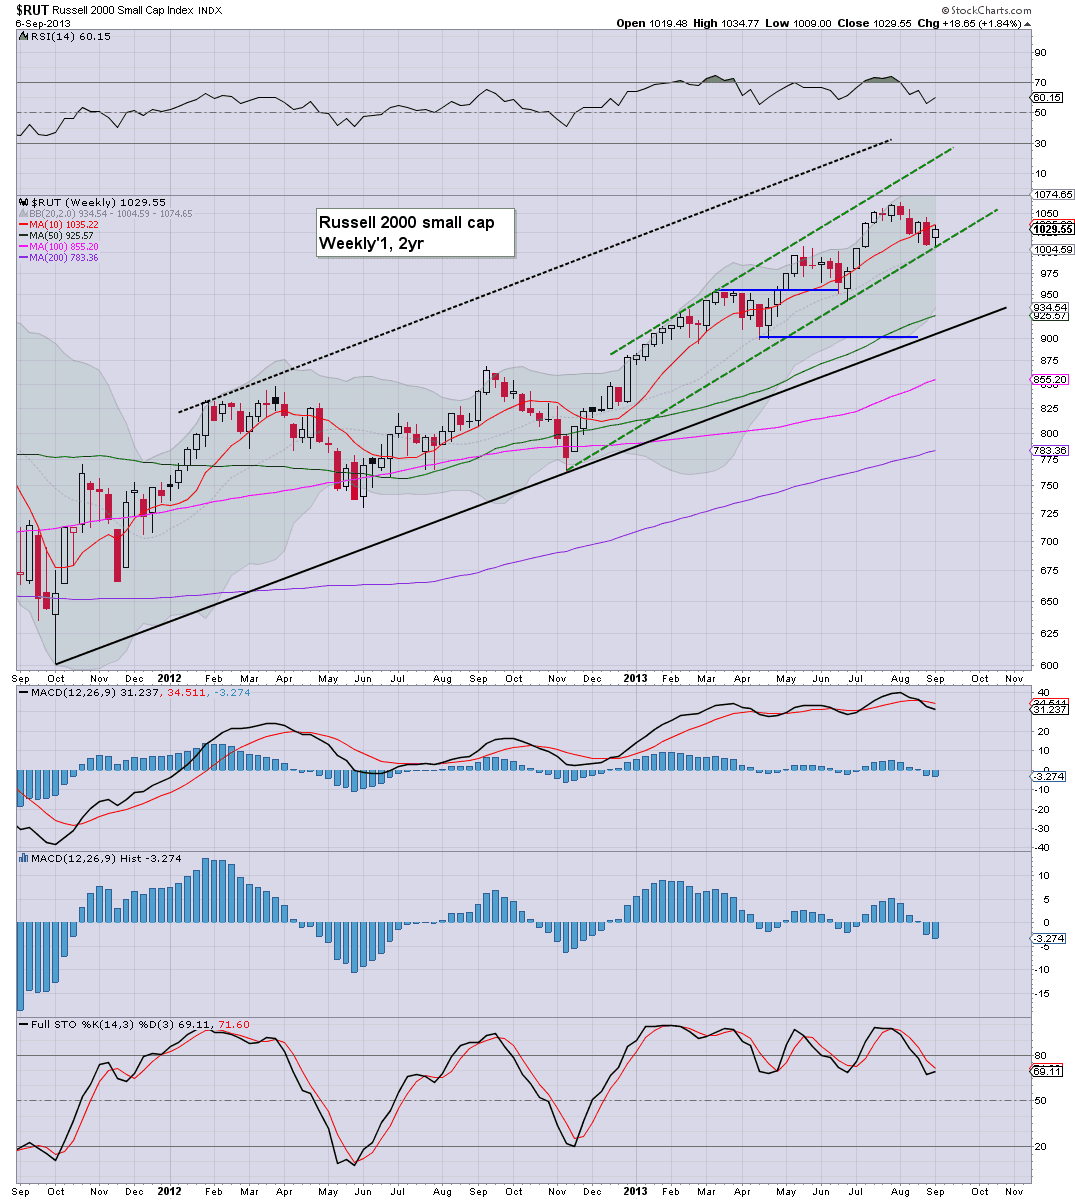
The second market leader climbed 1.8%, and is holding the channel that stretches back to the Nov' lows. Bulls can sustain a drop to 950/925..and that will do no critical damage to the broader upward trend from the Oct'2011 lows. Those seeking 'autumnal market upset' should be seeking R2K in the 800/750 zone, but obviously, that is an extremely long way down, a 'crashy' fall of around 25/30%.
Trans
The old leader climbed around 1.9%, but again closed under the weekly 10MA. First key downside target is 6100/6000, that is about 6% lower.
Summary
It was a week where the bull battled back, but only to sp'1664, and that closing hour on Friday sure didn't look bullish! I will guess, the bears have at best the next week and a half in their favour. After that, the market will probably rally on 'FOMC only taper 10/15bn' news.
For those bears seeking significant autumnal declines - and a possible 'big H/S formation', the lower we go between now and the FOMC..the better. Breaking back under sp'1600 will be important
Bigger bearish outlook..still in play
Despite the gains of the past week, the near term trend remains somewhat to the downside. On the weekly 'rainbow' charts, the closing blue candle should be seen as a disappointment. However, bulls need a weekly close in the 1670s to get confident that new index highs are viable.
As has been the case since early August, my primary target is the lower weekly bollinger, currently 1579, but that will surely be in the mid 1580s next week.
sp'weekly9c - a hit of the lower trend

The above outlook remains the most bearish scenario I can come up with. All those seeking much lower levels in Oct/Nov, arguably need to see at least the sp'1580/70s in the current multi-week down wave. Otherwise, I have to assume new index highs will be hit, as early as October.
Looking ahead
In terms of data, there really isn't much of anything until Friday, where there is retail sales, producer prices, consumer sentiment, and business inventories. Other than that, the market looks set to be driven entirely upon Syria related news.
*there is significant QE-pomo on Thursday and Friday, both days: $3bn
Trading thoughts
Surprisingly, I am short the market - via VIX-long, across this weekend. I'm reasonably content with an entry in the VIX 15.50s (having bailed the previous Friday afternoon in the 17.40s). I'd like an initial exit early next week in the 18/19s, but am most definitely still looking for VIX in the lows 20s before the FOMC of Sept'18
There is a real threat to the bears in terms of the 'lets bomb another country' vote. I'm not sure when the vote is due, but if the US congress critters fear a public backlash, a no-vote, would surely send the market soaring..at least briefly. Certainly, I'll be reluctant to hold any short positions ahead of an immediate vote.
With the weekly equity/VIX charts still broadly in favour of the bears, I'm kinda looking forward to next week. I think there will opportunity to make a couple of good trades.
back on Monday :)
--
Video update from Walker
--


