Lets take a look at the weekly index cycles, for the six main US indexes.
IWM (representing Rus'2000 small cap)
IWM hit the key 76 level, and saw a slight bounce on Friday - along with the main market. There is no sign of a turn in the general downward trend, a break into the 75s, would be highly suggestive of a swift move down to around 74-72.
It would be understandable if the low 70s is the lowest we go this year, with a multi-week bounce into year end. If the market gets 'spooked', first target would be the 200 MA @ 67.50 - that is 15% lower, and would equate to sp'1200.
Nasdaq Comp
The once super strong tech' sector remains weak, and looks set to soon test the June low of 2725. If market gets upset at perceived 'unlikely resolution' of the fiscal cliff, first target is the big 200 MA @ 2450.
We are getting pretty low on the MACD (blue bar histogram) cycle though, so it would not be surprising if we see a multi-week bounce into January.
Dow
The big Dow'30 is now way below the old support of 13k. Next stop would be a challenge of the June low @12k. A failure to hold 12k would open up a swift drop to somewhere around 11250/11k - which is supported by the monthly charts.
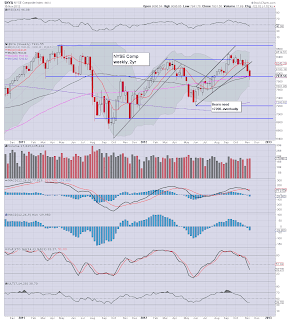
NYSE Comp
The master index has put in a weekly close under the big 8000 level. This is important, and next target is the June low in the 7200s. That is 10% lower, and that would again equate to sp'1200.
SP'500
My original primary target of sp1345 was hit Friday morning, and this was indeed very pleasing to see. The next obvious target for doomer bears is an attempt to break the June 1266 low.
The monthly charts remain targeting sp'1200/1175 'sometime' within the next few months. It may indeed take until the early spring to hit those kind of levels. Yet, we do have massive market concern about the fiscal cliff, and there is also the weakening global economy.
We are kinda low on the MACD (blue bar histogram) cycle, but its possible we could drop for a few more weeks, before a multi-week bounce.
Transports
The tranny remains in an extraordinary tight trading range since the start of the year. The wedge/triangle, keeps getting redrawn by many chartists out there.
What is clear is that first downside target is a break of the 4800 level, if that occurs, there is a viable swift wash-out move lower to the 200 day MA @ 4500 - where there is also historic support from the Oct'2011 lows.
As it is, the trend remains downward, and there is plenty of downside potential on the MACD cycle.
Summary
An interesting week in market land, and one where although there remains no market panic - certainly the VIX remains bizarrely low, but where we are continuing to see relentless weakness.
The rallies are being sold into...EVERY time, which I find particularly amusing. It sure makes a change from the 'buy the QE hope' rally we saw from June>September.
Bernanke killed the market
QE3 was announced Thursday Sept'13, and just about every stock and index maxed out on the subsequent Friday. It would indeed be the ultimate irony if the market did indeed put in a multi-year top at sp'1474.
 |
| Market has been in a bad mood since QE3 announced |
As many noted prior to the QE3 announcement, 'if the market is rallying on hope of QE, what happens to the market when it gets it?'. It does indeed appear that the Market got what it wanted, and is now filled with despondency, and worse, market thoughts are turning back to the fundamentals..which are looking pretty lousy into early 2013 - regardless of the looming US tax rises and spending cuts.
Of course, we can't be sure of a market top until we first take out the June 1266 low, and also put in a vital lower high on the bigger monthly charts. That process will very likely take a good 6-9 months. So, all those doomer bears looking for the 'trade of a life time', are going to probably have to wait until the latter half of 2013.
Looking ahead
As for next week (see Friday evening posts), best guess remains moderate Monday morning gains, then a rollover into Tue/Wed, possibly flooring in the low sp'1330s. I would be looking to close all shorts at that point, not least due to the thanksgiving holiday period*
*Market is closed next Thursday, and is only open 9.30am >1pm on Friday.
I will return on Monday :) Good wishes from London city.


