Friday 16 March 2012

Another bullish week over

Well I close the week positioned long into next week.

Lets end this week with a trio of charts to close out the week...

SP'weekly - VERY bullish, a clear breakout


VIX'weekly - a complete fail for the bears


SP'monthly - targeting 1550 this summer


It has been a difficult week, it certainly did not end the way I expected (or is that 'hoped'?) for. As ever....good wishes for your weekend!

IWM - Bullish into the summer

Good morning. Here is something to begin your opex Friday....

IWM - weekly cycle, bullish outlook


This is similar to the SP' chart I've posted a few times lately, the 'p3 ain't even started yet' theory. Without question, we have a bull flag being confirmed, and a move to 85/87 within the next few weeks looks comfortably viable.


The Swans are not being allowed to land

Despite all the Black Swans circling (and there are a LOT of them)..none of them are currently permitted to land by the Bernanke. I kinda picture him with a ground to air missile battery, and he is very much still in control.  Occasionally he'll fire off a few missiles, take out any of those Swans that are looking to land.

IWM targets:
near term: a break above the recent high of 83 - 84/85 confirms the bull flag

1-3 month target: 90-92.

It looks like the ultimate psy' level of 100' will not be reached..unless we see the market go parabolic - in the style of the 1999/ early 2000 tech bubble.

Good wishes for Friday.
 --

UPDATE: 11.25am EST

Exited IWM puts earlier, am now long via iwm Calls

Yeah, the Permabear is now Long. A very difficult few buttons to press, but its my 'best guess'.

It could easily be the sign of a top (often is), but..the weekly chart says UP UP UP, at least to test 86 within a few weeks. I've done all I can.


more later...

Bond Market - some interesting developments

I wasn't planning on another post today, but I thought this was worth noting. There is something going on in the Bond Market. Even Clown channel noted it a few days ago.


Tbill Yields - monthly cycle (10yr view)


The last time we saw such a severe rise in yields was late Summer 2010, and the bears should remember what that period marked - an equity market low, before one of the most painful (around 30%) melt ups in history.

Just look at the MACD (green bar) cycle, we are due to go positive cycle most probably in May. That would be when the more significant 'snap higher' would occur. I suppose it is possible the cycle could fail to break back above the 0 line - just as it did in 2008, but such an outcome would be highly unusual.


What does this all mean though?

The Bond Market is really something I am not very familiar with. However, historically speaking, if Bond prices lower (with yields higher)..then Equities.... higher. Its usually that simple.

So..right now...this chart is suggesting that the main market will be higher in April, and that May offers even more intense higher moves.

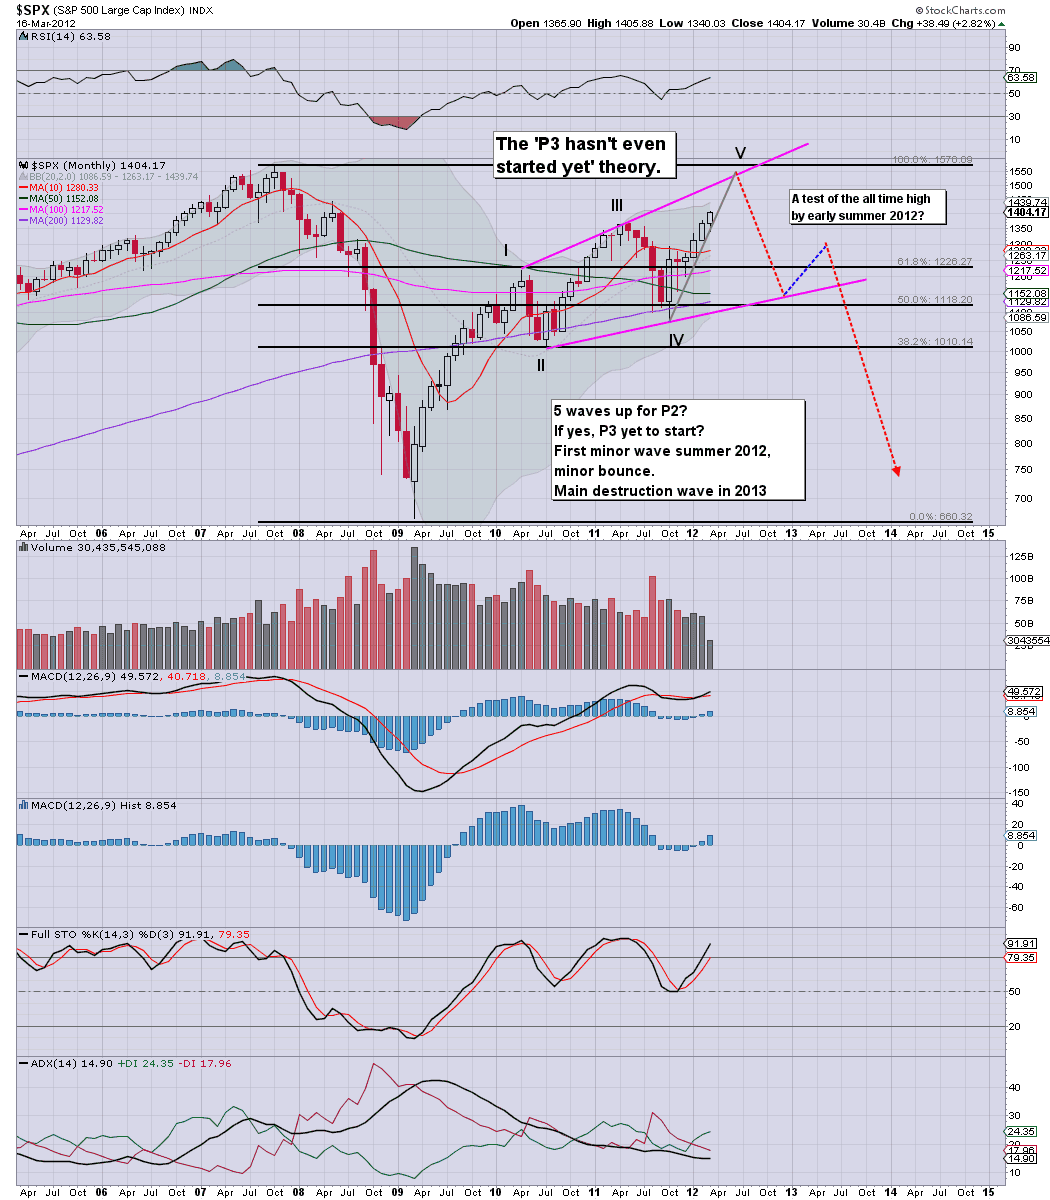
This Sp' monthly chart would make sense then...


It would certainly match up with the Bond market chart, and suggest that the main indexes will make a challenge to the all time price highs sometime within 2-4 months.

If that outlook is correct, then the bears presently holding short will get washed away, long before any distant 'black swan/doom wave' even begins to unfold.

Goodnight (again)