Thursday 6 June 2013

Volatility knocked lower

With the indexes seeing what is arguably a reversal day, the VIX could not hold the marginally higher highs of 18.51, and closed distinctly weak, -5% @ 16.63. Near term trend looks weak, and VIX could easily close the week in the low 15s.


VIX'60min


VIX'daily3


Summary

The daily index charts look pretty good for those on the bullish side, but the VIX daily chart looks even better for the bulls. Today's closing candle looks very weak for the VIX, and there is little reason why we won't see VIX in the low 15s by the Friday close.

Indeed, if equities have just put in a short term floor at sp'1598, then VIX could fall into the 13s within the next week or two.

more later..on the indexes

Closing Brief

The indexes broke a new low in the morning to sp'1598, but we saw a very strong latter day reversal, with most indexes closing moderately higher. The sp' close of 1622 bodes very badly for the bears tomorrow if Mr Market decides it likes the monthly jobs data.


sp'60min


Summary

...as expected.

As noted earlier, bears had almost two full days to exit in the 1610/00 area.

If we're in the 1630/40s tomorrow, there can be no excuses for any complaints.
 --

bits and pieces across the evening

3pm update - closing hour gains?

The market has appeared to put in a floor at sp'1598, and we're already almost 1% higher. Bulls should be content with any close >1610, but if there is even a small short-stop cascade, 1620s are viable. VIX is continuing to cool down.


sp'60min


sp'daily5


Summary

So..we're starting to see some initial sign of a rally, but clearly, its only two hours old....and daily charts will take 2-3 days to confirm a turn..never mind an actual rally itself.
--

A close in the sp'1620s would be a real bonus for those on the long side, not least those who have been boldly building new long positions since yesterday.


UPDATE 3.27pm..well, still 30mins to go, and we're just 4pts shy of the 1620s.

I have to think, the 1630/40s are viable early tomorrow. The bears who been shorting this since the 1680s have had almost TWO full days to exit.

There can be NO excuses tomorrow of 'oh noes, my winning position went against me'.


3.33pm.VIX daily chart now offering the most bullish equity sign....


We have the MACD cycle starting to tick lower....we have a rollover.

2pm update - another minor rally attempt

The main indexes are still weak, but there is significant risk of upside into the Friday close. Bears have hit their primary target gap zone of sp'1600/1598. All things considered, a multi-day ramp looks imminent.


sp'60min


vix'60min


Summary

*as I type, we're seeing a rather strong reversal in equities..and being confirmed in the VIX.
--

Regardless of how we trade into late Friday, its still going to take 2-3 days to have any clarity that a near term floor has been put in.

Even if we are trading in the 1630/40s tomorrow - as difficult as that might seem, that still doesn't mean we won't see one final wave lower

Plenty of chartists out there counting the current action down as a 3, with a 4 bounce to come..and then a fifth...early next week.
---

*I remain heavy long (yes..am underwater), and seeking an exit in the low sp'1640s...within the next 3-5 trading days.
--

2.13pm...well, we're right on the edge of a major snap to the upside.

Hourly charts are PRIMED for major upside. Sure it could fail..but I'm guessing...no.

--
2.29pm...and away we go. Hourly index cycles breaking to the upside.

A close in the sp'1620s would offer 1640s by the Friday close..and that would no doubt annoy all those bears holding short..seeking much lower levels.

1pm update - there go the sp'1600 stops

Well, another minor wave of weakness has been enough to hit all those bulls with long-stops at the big 1600 level. It is now arguable that the key gap from May'3 has been filled, and we're sitting in the primary target zone. Best guess remains...we are in a flooring stage.


sp'15min


sp'60min


Summary

Certainly, the loss of sp'1600 has rattled a few out there, and now some will even be looking for a further move down to sp'1550/30. I just can't see that happening.

Bears have yet to put in a single lower high on the weekly charts.

Best guess...we rally from this area...for a week or two..and then down - after that lower high.
--

RE: 15min channel. Bulls clearly need a close outside of the channel, which by the close is a mere sp'1610.

Transports now declining 0.3%, after earlier gains of 0.6%. 

12pm update - exhausted bears

The market did break a little lower at the open, but it sure feels like bears are tired in this down cycle. Its day'11, and the market is due some level of bounce. With the big monthly jobs data tomorrow, Mr Market appears to be 'ready and waiting'.


sp'60min


sp'daily5


Summary

So far we've not seen any real kick to the upside, but its surely coming. It won't take much, just a break above the hourly 10MA, currently 1614..and declining.

Best case for the bulls by the close..sp'1625. Right now, few are expecting it, but with four hours to go..that's plenty of time.

*transports still holding reasonable gains of 0.65%. 
--

12.18pm.. sp'1604..another new low. Transports/R2K holding minor gains though.

--
VIX update


stay tuned


12.32pm..well, there go the sp'1600 stops. We've now arguably closed a key gap, and hit the primary target.

I await with interest, where we are by the Friday close.

11am update - still choppy

The main indexes look floored, and there are very tentative signs of a turn. It will probably take another two days to have a decent confirmation though. After the last 11 days there are probably a fair few shorts to cover, so when the covering starts, it could be pretty wild on the upside.


sp'60min


Trans,daily


Summary

I think the downside is done, and now my eyes are on the daily MACD (blue bar histogram) index cycles.

We do NOT have a turn/levelling phase yet, but I'm guessing there will be one within the next 2-3 days..and once it starts battling higher, bears have to stay well clear of this market, probably for a few weeks.
--

First upside target for the bulls should be sp'1635 by the Friday close. That is viable, if the market decides the jobs data are signs of 'summer of recovery'..version 5.0

Oil snaps to the upside...

USO, 60min


It looks like Oil is perhaps a provisional sign of the equity rally to come. Its broken out of a very clear wedge...as expected. Upside to the 35s within a week or two.
--

UPDATE 11.21am.. any break >sp'1614, and we have immediate snap possibility to 1625.

11.43am...right on the edge of a snap...to the upside. 

10am update - hourly charts warning of upside

The bears have seen the market slip from 1687 to 1605 in eleven days, that's a pretty good move, but on any basis, we're now due another bounce. Bulls should be seeking a Friday close >1635, that will open up a rally into June opex.


sp'60min


sp'daily5


Summary

VIX is starting to show signs of a fail, and the indexes are yet again trying to put in a spike-floor.

Today..and indeed tomorrow could be a bit tricky,.but I have to think, underlying pressure should start to increase to the upside with each passing hour.

Bears had a good run, its arguably time to exit..and wait for a re-short sometime around opex.
--

*I remain long (yes, underwater), but I think there is a very high likelihood of the sp'1640s, if not the 1650/60s within the next 3-7 trading days.
--

UPDATE 10.40...it remains a choppy mess...but underlying pressure is still increasing to the upside. 

Pre-Market Brief

Good morning. Futures are moderately higher, sp+7pts, we're set to open around 1615. Precious metals and Oil are similarly a little higher, helped by a weaker USD. Daily index trends are still to the downside, but we are probably close to flooring.


sp'60min


vix'60min


Summary

*weekly jobless claims: 346k, nothing particularly good...not 'that bad'.

--
So, we're set to open a little higher. Its hard to know if this is merely a wave'4 bounce, before a final move lower late today/early Friday.

Regardless, I think the floor is 'close', and I'm seeking a significant 5-10 bounce, at least to the sp'1660s.

Whether we then put in the first lower high of the year, that is the big question.
--

Good wishes for the day ahead!
--

ps. Anyone in the UK, turn on Channel'4. Kinda appropriate movie right now.
--

Morning video from Mr Permabull


HIs 'new economy' is not the economy I want to live in.

9.22am.. Mr Draghi not exactly inspiring confidence..market now set to open flat..if not a touch lower. 

9.41am... messy open..minor drop..now a pop higher...

Hourly index MACD cycle is ticking higher still...bears beware. Very considerable risk of upside into the Friday close.

Transports clarifies the bigger picture

Perhaps the most important aspect of today's bearish price action was seen in the Transportation index. The 'old leader' has broken the rather critical rising channel support, on the weekly cycle. It is now highly probable that a mid-term top has been put in.


Trans'weekly


Trans'weekly2, rainbow


Summary

Today's close for the Tranny was about as bearish as any bear out there could have hoped for. Not only do we get a close decisively below the key 6200s, but it breaks the rising channel. On the weekly rainbow (Elder Impulse) chart, we even have our first red candle. Of course, the week is not over yet, and we could flip back to blue, but the point is...lower highs...lower lows.

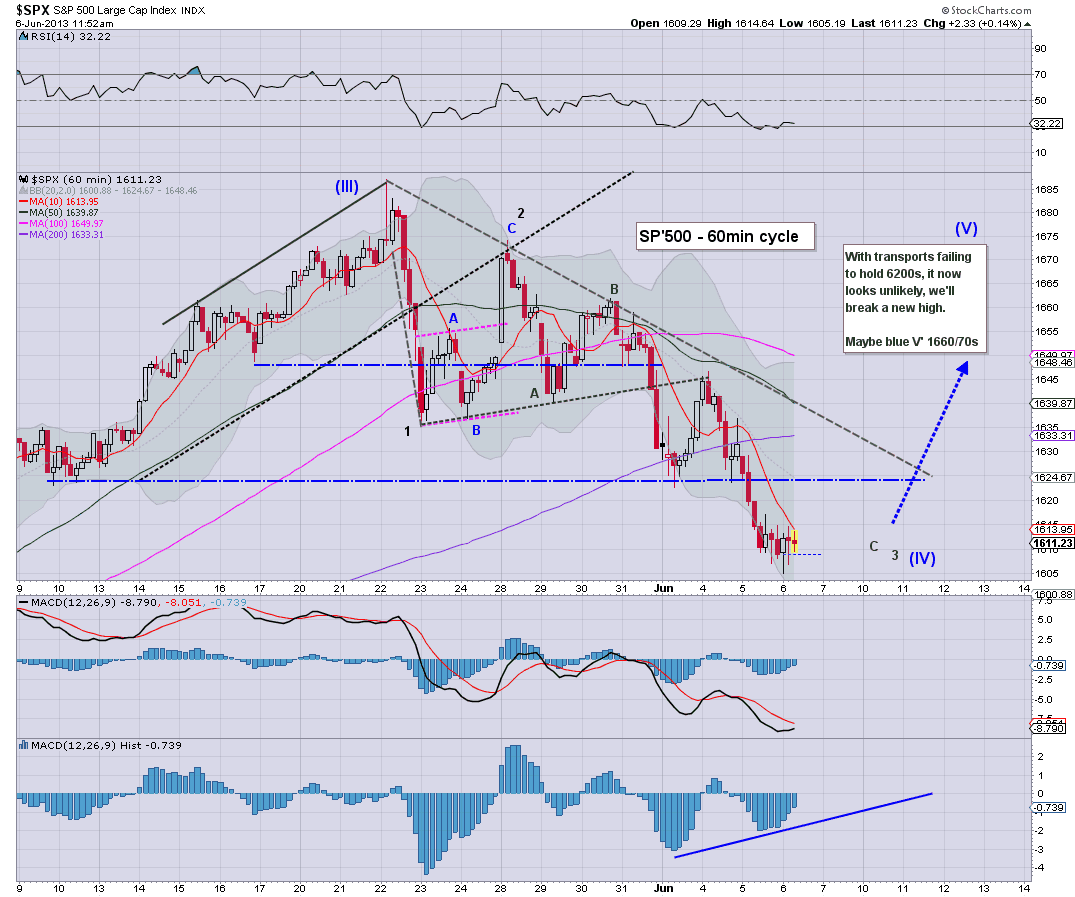
Transports is HIGHLY suggestive that a mid-term top is in. In terms of sp', it looks more likely than not that sp'1687 will now also mark a key high. Bears should merely look for a lower high in the next 5-10 day rally.


Staying with the transports, the monthly chart is also starting to rollover.


For those doomer bears out there seeking much lower levels in the weeks..and months ahead, the above chart is probably the most bearish out there right now. We now have our first blue candle..the first non-bullish candle since Sept'2012. 

--
**Bonus chart

The following is just something I think might help clarify what is now my 'best bear case' outlook for the next month or two.

sp'weekly'7


The key point to note is that in any multi-week down cycle, primary target should be the lower bollinger band (weekly cycle). That seems to be a very valid target, and has been a good floor in the last 3 or 4 down cycles. 

If we get down to the sp'1550s or so, what will then be interesting to see is what level of bounce do we get in the subsequent 4-6 weeks. Naturally, some will be looking for a July/August'2011 scenario, and certainly, the monthly index charts are looking over-stretched.


Looking ahead

The only econ-data of note tomorrow is the weekly jobs data, market is seeking 345k. As noted earlier, hourly index charts are suggestive of some degree of bounce, but it might not be much.

A hit of the sp'1600/1597 zone seems very viable tomorrow/early Friday, before the next 1-2 week up cycle - which itself might put in the first key lower high.

*as for yours truly, I will merely seek to exit (existing 'underwater' long positions) in the upper sp'1630s, if I have to wait until next week...I can just about live with that.

Goodnight from London

Daily Index Cycle update

The main indexes were weak across the day, and closed very near to the lows. The sp' close of 1608 is now offering the bears immediate opportunity to hit the widely targeted 1600/1597 area. Near term trend remains unquestionably weak, but we're surely getting near to flooring.


sp'daily5


Trans


Summary

Well, yesterday afternoons little rally into the mid 1630s now looks a long way up. On the other side, the big 1600 level now looks viable at the Thursday open.

Best guess...we make a floor within the next day or two..and then 1-2 weeks up - which would take us all the way into June opex.

Hourly index charts (see earlier post) are suggestive of upside tomorrow, but that is very unreliable right now, and a brief hit of 1600 seems more likely than not.

a little more later