Lets take our regular look at six of the main US indexes
sp'500

A net weekly decline of -47pts (2.2%) with a Friday low of 2077. Perhaps most important of all, the weekly candle was of the bearish engulfing type, and was a full reversal of the previous weeks gains.
Underlying MACD (blue bar histogram) cycle remains negative, and is increasingly swinging in favour to the equity bears. First key support on the weekly cycle is the 2055/50 zone. Any sustained break <2050 would bode that a summer high is already in at 2134.
If sub 2050s, then first target is rising channel/trend, which next week will be around the giant 2K threshold., which would equate to Dow 17000, and VIX in the low 20s.
Nasdaq comp'

The tech broke a new historic high of 5231, but then followed the rest of the market with increasing weakness into the weekend, with a net loss of -2.3% @ 5088. First support is the 5K threshold, and then 4900. Any sustained trading <4900 would be suggestive that an intermediate high has been achieved. First big downside target would be the 4700s in August.
Dow
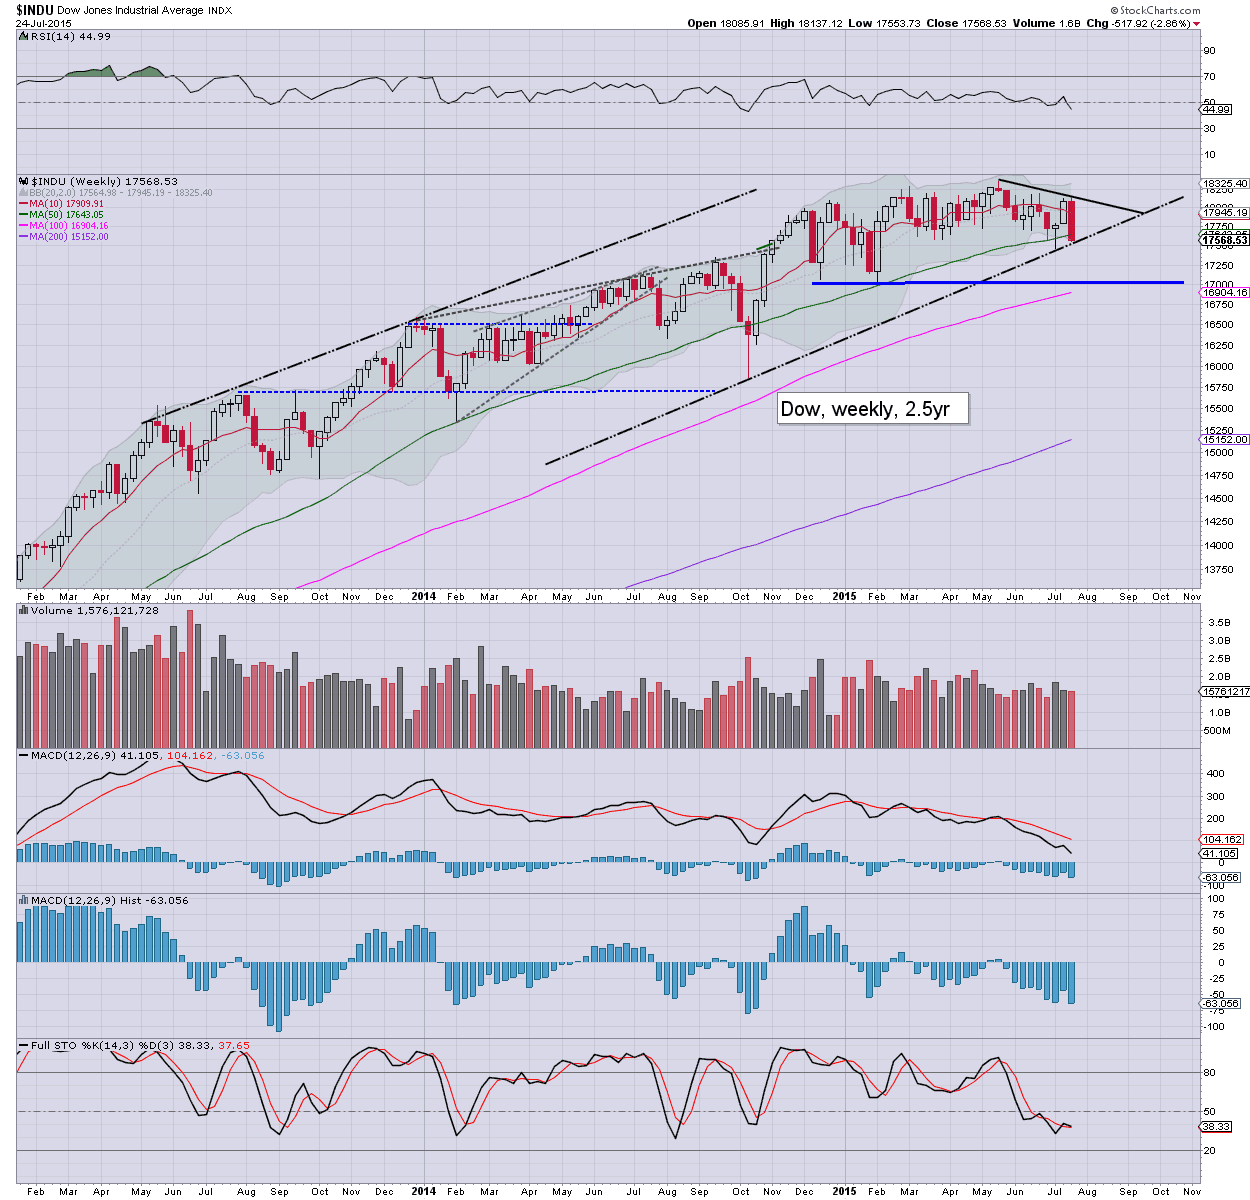
The mighty Dow saw a net weekly decline of -518pts (2.9%). The weekly candle was of the extremely bearish engulfing type, and recent price action bodes for a break of rising trend (17500s) early next week. There is nothing but empty air down to 17K... which would equate to sp'2K. Best bearish case into the early autumn will be the 16500/000 zone.
NYSE comp'

The master index declined -2.4%, back into the 10700s. A failure to hold 10600 next week will open up the 10200/000 zone.. back to the Oct' 2014 low.
R2K

The second market leader saw a somewhat severe net weekly decline of -3.2% @ 1226. First support is the 1200 threshold. If that fails.. then 1160/40 zone. Sustained action under the Oct'2014 low of 1040 looks unlikely on any bearish outlook.
Trans
The 'old leader' lost another -2.7% @ 8072. With the 8K threshold already having been recently breached, it would seem the Oct' 2014 low of 7700 will be hit. Broader downside into the early autumn looks due.. to the 7500/250 zone.
Summary
It was a pretty dynamic week, with new cycle highs on Monday - not least a new historic high for the Nasdaq comp'. Yet from there, things increasingly spiralled lower. The Friday close was very bearish, and with some bearish engulfing weekly candles, further downside looks due in the first half of next week.
The following outlook for the Dow applies (at least in direction) to all other indexes....
Dow, weekly2

Regardless of whether the market can hold support early next week, and resume higher into August, I am seeking increasing equity weakness across the mid-August to early October time period.
To be clear, I do not believe a key multi-year top is in, and I remain of the view that higher rates will be bullish for the US economy and equity market for another two years. If I am correct about equity weakness across September, I can't see the Fed' raising rates until at least December.
--
Looking ahead
A very busy week is ahead, not least with an FOMC meeting, and a truck load of corp' earnings.
M - Durable goods orders
T - Case Schiller HPI, PMI service sector, consumer conf', Richmond fed'
W - Pending home sales, EIA oil report, FOMC announcement (2pm)
*there will NOT be a Yellen press conf'. Market is not expecting any rate rise, but will be looking for any hint of a Sept' hike of 25bps.
T - Q2 GDP (first reading), weekly jobs
F - Employment cost, Chicago PMI, Consumer sent'
--
As for yours truly...
Until I see a clear break - and right now on the sp'500, that is arguably around 2050, I will be very cautious, and continue to trade 'light'. If I see the 2040s at any point in the coming week, then I'd drop the notion of new highs in August.
Say for instance we drop to around sp'2000... there will no doubt be a sig' bounce (probably spanning 1-2 weeks), but with clear breaks of trend, the next daily cycle top will be a far more reasonable situation to launch a much larger market short trade.
Sunday night futures could be interesting, not least for the Gold bugs, as Gold (along with Silver and Copper) will be very vulnerable to falling into end month, as is usually the case.
Back at the Monday open :)


