It was a somewhat mixed week for US equity indexes,
with net weekly changes, ranging from +1.2%
(Nasdaq comp'), +0.5% (sp'500, R2K), -0.3% (Dow), to
-2.8% (Transports). Near term outlook offers brief cooling of around 1.5% to the sp'2430s, before making a more serious push to the 2500s in August.
Lets take our regular look at six of the main US indexes
sp'500
The sp' settled net higher by 13pts (0.5%) to 2472, with a notable new historic high of 2477. Underlying MACD (blue bar histogram) ticked higher for a second week, remains fractionally negative, and is due a bullish cross within 1-2 weeks. The key 10MA is at 2432, and by September, will be close to 2500.
Best guess: near term cooling to the 2430s, before resuming upward into end month. August looks set for further upward melt, with the 2500s highly probable by early September. A 5% retrace seems viable within the 'delicate period' of Sept/Oct. The year end target of 2683 remains on track, but will require at least one further rate hike, to help kick the financials upward.
Equity bears have nothing to tout unless the mid term upward trend - from Feb'2016 is broken. As of early August, that will be around 2370.
--
Nasdaq comp'
Tech continues to lead the way upward, with the Nasdaq settling +1.2% at 6387, with a notable new historic high of 6398. Price momentum is set to turn positive next week, as the 6500s seem viable by September. The 7000s are just about within range by year end. Does anyone seriously think we'll trade under 5k any time soon?
Dow
The mighty Dow saw a minor net weekly decline of -0.3% to 21580. Underlying MACD remains fractionally negative, but will surely turn positive within 1-2 weeks. Upper bollinger will be offering the 22000s in August. Things will only turn provisionally bearish if the Dow is trading <21k from September onward.
NYSE comp'
The master index settled +0.2% at 11924, with a notable new historic high of 11963. Broader price action remains very strong. The 12000s look a given by late summer. Things would only turn bearish if a break <11800, from Sept' onward.
R2K
The second market leader - R2K, settled higher for a fifth consecutive week, +0.5% at 1435, with a notable new historic high of 1452. Underlying MACD has turned fractionally positive for the first time since mid February. Core rising trend will be around 1410 next week. Many now seem resigned to the 1500s.. or even 1600s by spring 2018. I will continue to note that its ironic that I seem to be the only one suggesting 'R2K @ 2K'.
Trans
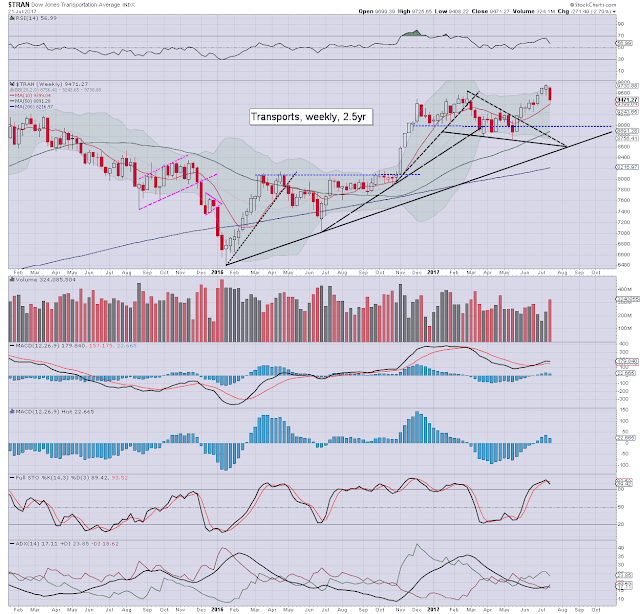
The 'old leader' - Transports, had the worse week since (at least) April, settling -2.8% at 9471. Its notable though that last week saw a new historic high, as the equity bulls have very little to prove. The psy' level of 10k remains probable by late September, especially if WTIC/fuel prices see another significant wave lower.
--
Summary
All US equity indexes remain within their mid term upward trends from early 2016
The US equity market is regularly breaking new historic highs in ALL six indexes
There is downside buffer of around 5-7% for most indexes, before multiple aspects of support would be challenged.
--
Looking ahead
In addition to a truck load of corp' earnings...
M - Existing home sales
T - FHFA house price index, Case-Shiller HPI, consumer con', Richmond fed'
W - New home sales, EIA Pet' report
FOMC: a press release will be issued at 2pm. No policy change is expected. There will NOT be a press' conf'.
T - weekly jobs, durable goods orders, intl' trade, EIA Nat' gas
F - Employment costs, consumer sent', GDP Q2 - market is seeking growth of 2.6%, against Q1 1.4%. Arguably, any number >2.5% will put renewed pressure on the fed to raise rates in Sept', or certainly by Dec'.
*the only fed official scheduled is Kashkari (Friday), whom has notably dissented against both rate hikes this year.
--
If you value my work, subscribe to me.
Have a good weekend
--
*the next post on this page will likely appear 6pm EST on Monday.


