Wednesday, 10 April 2013

10am update - early FOMC release

Good morning. With the FOMC minutes being released early, bulls are getting an early boost. After all, there is again no sign that QE will end. The sp' breaks the Oct'2007 high of 1576.09, by the narrowest margin of 0.01pts. Precious metals and Oil open somewhat weak.


sp'60min


vix'60min


Summary

Its difficult what to make of the current action. I suppose you could call it 'bear capitulation', but what is clear, we ain't down.

The only indexes that still count well are Trans and the R2K.

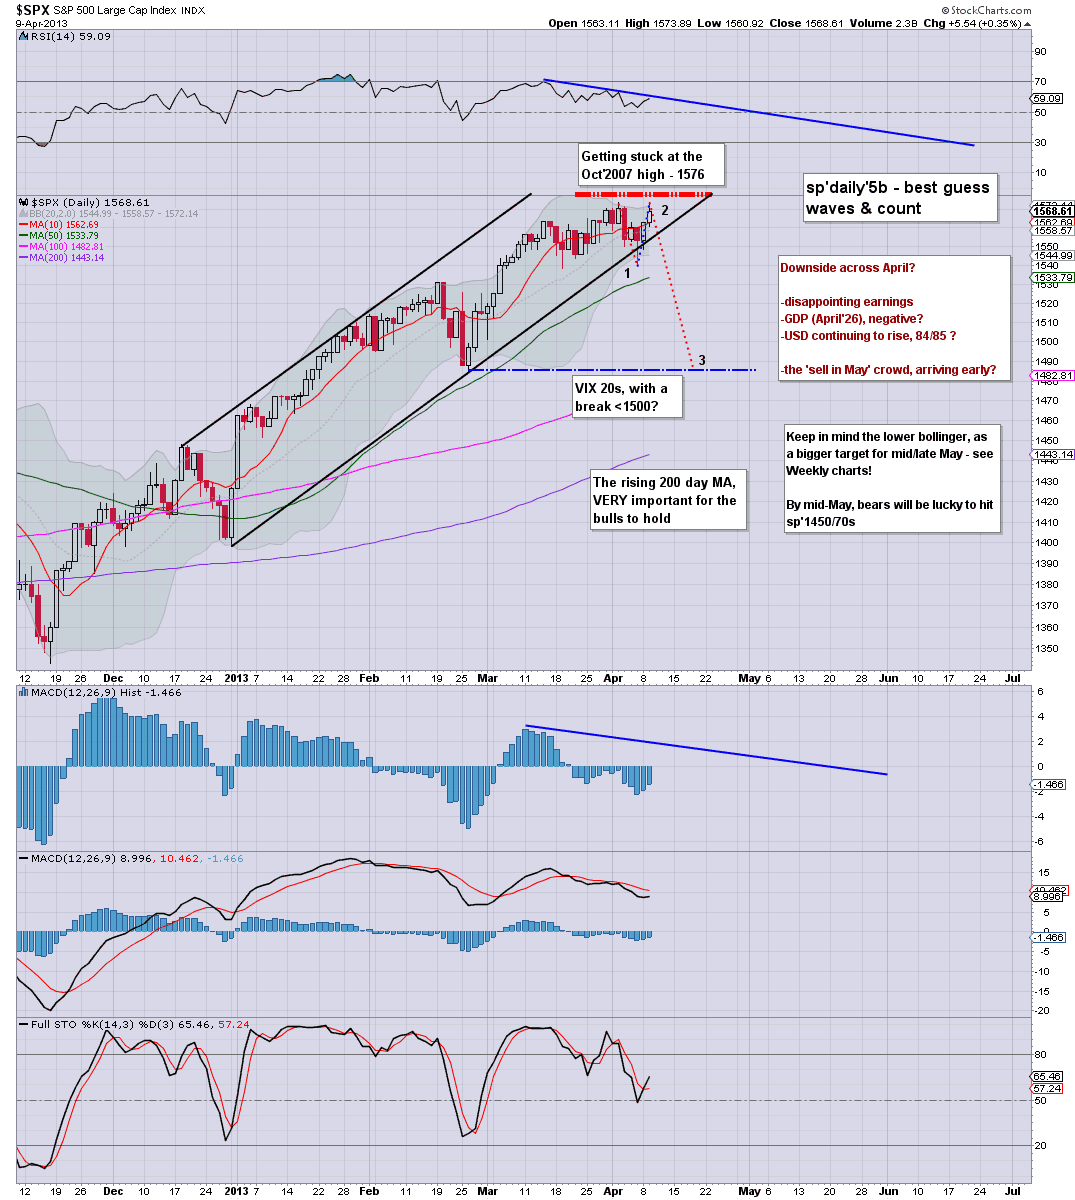
I suppose some might count the recent drop as a sub' wave'4, and this is the 'final fifth', but who knows. Its frankly,,getting messy.
--

The transports and Rus'2000 continue to remain well below their recent highs, but I'm starting to wonder if this disconnect is not something that might last weeks..rather than just a few days.

As many realise, we could trundle sideways or slightly higher for much of April. May remains the primary month for significant downside, and even then, how is that going to happen whilst QE-POMO is continuing?
--

I suppose the one thing bears no longer need be concerned about later today, is what those printing maniacs at the Fed have to say.

--

UPDATE 10.23am... sp'1579..and still no sign of stopping.

In fact, if you look at the daily MACD (blue bar histogram) cycle, its not even positive cycle yet..and could easily battle higher for another few days.


So, all those who were touting sp'1600s before a significant pull back...it looks like they were right after all.


10.35...Metals look weak...GLD is a lousy long, unless its >158


SLV is even worse of course, always moving 2x the amount of GLD

Sp'1480s remain primary target

Another day where the bulls can tout new index highs for the headline Dow and SP'500 indexes. Yet, as some are noting, there are still some signs that we're due a significant multi-week down cycle. The last two days have done nothing to negate the mid-term outlook.


sp'daily5b - best guess


sp'daily5 - mini H/S formation, with larger HS


Summary

I've adjusted my 'best guess' chart a little. I'm making the assumption that the Trans and Rus'2000 indexes are telling the real story. They both look like they are completing a wave'2 bounce - from the Friday low, and thus a wave'3 is STILL due.

I realise that to extrapolate from one index to another is not always a good thing, but right now, that's the best I can come up with.
--

A wave'3 - especially when taking into account a possible mini H/S formation, would be suggestive of sp'1505..if not even 1485 in the very near term.

Yet, I have to admit, when I look at daily chart '5, that sure looks a 'bold' and overly bearish outlook, but then, that's what wave'3s are meant to be, right?


Weekly chart...still bearish blue

I will again highlight the overly simplistic, but still useful weekly rainbow chart....


Despite the last two days, we still have a blue candle - the fourth consecutive one, and it is still a very important warning that we are probably at a key cycle top.

--
*For the record, I'm still short from the sp'1550s, and seeking an exit in the next 3-5 trading days, preferably <sp'1530


Looking ahead

Wednesday is again quiet in terms of econ-data, but we have the FOMC minutes @ 2pm. Mr Market will be very much focused on that. Its hard to call how the algo-bots - and mainstream media will interpret what might have been said at the last Fed meeting.

What is clear, price action will likely be more dynamic than today.  Considering the hourly index  and VIX cycles, I have to believe we'll see a market snap down.

--
Video bonus - from Gordon T Long, with guest Ty Andros. It is somewhat serious macro-economics chat, but highly recommended for those interested in where we are headed.


Goodnight from London

Daily Index Cycle update

The market is now split in two. The Dow and SP' have broken to new highs, yet the two leading market indexes - Transports and Rus'2000, are both still considerably below their recent highs. Considering they lead the way up, traders should be very mindful of those two laggards.


IWM


SP'daily


Trans


Summary

What can we make of today?

The Dow unquestionably broke to a new high, whereas the SP' merely put in a fractionally higher high..which in itself is arguably a double top formation.

Meanwhile, the two main powerful bullish leaders from winter 2012 - Transports and Rus'2000 are still well below their highs.

I have to place more respect in those indexes that lead the way higher, than the more media/mainstream indexes of the Dow, SP, and even the Nasdaq - although the latter is ironically the biggest laggard of all.

Underlying MACD (blue bar histogram) ticked higher again - to be expected, but is still in negative territory. Bulls need to keep pushing here, or the snap lower could be fierce.

As I noted last evening, if what we are seeing is a mini-H/S formation, then it is suggesting we'll be trading in the sp'1505/00 zone within the very near term..and other daily charts support the idea of sp'1480/70s within a few weeks.

a little more later