It was a very choppy, but bearish week for US equities. Net weekly declines ranged from -4.3% (NYSE Comp'), -3.5% (sp'500), to -2.5% (R2K). Despite the significant declines, outlook is for renewed upside in the remainder of the year... if not all the way across spring 2015.
Lets take our regular look at six of the main US indexes
sp'500
A major decline of 73pts (-3.5%) for the sp'500. The weekly close of 2002 is interesting in that it makes for a very natural flooring area, not least with the 50dma lurking close by.
Best case for the equity bears is either 1980 (38% fib retrace) or 1950.. where the 200dma is lurking. However, both of those targets seem quite unlikely, not least with price action providing regular powerful bounces.
Underlying MACD (blue bar histogram) cycle is set to turn negative at the Monday open.. so there will be some downward pressure early next week. Best guess... market floors around sp'2000... and then battles upward into year end... with the sp'2100s in January.
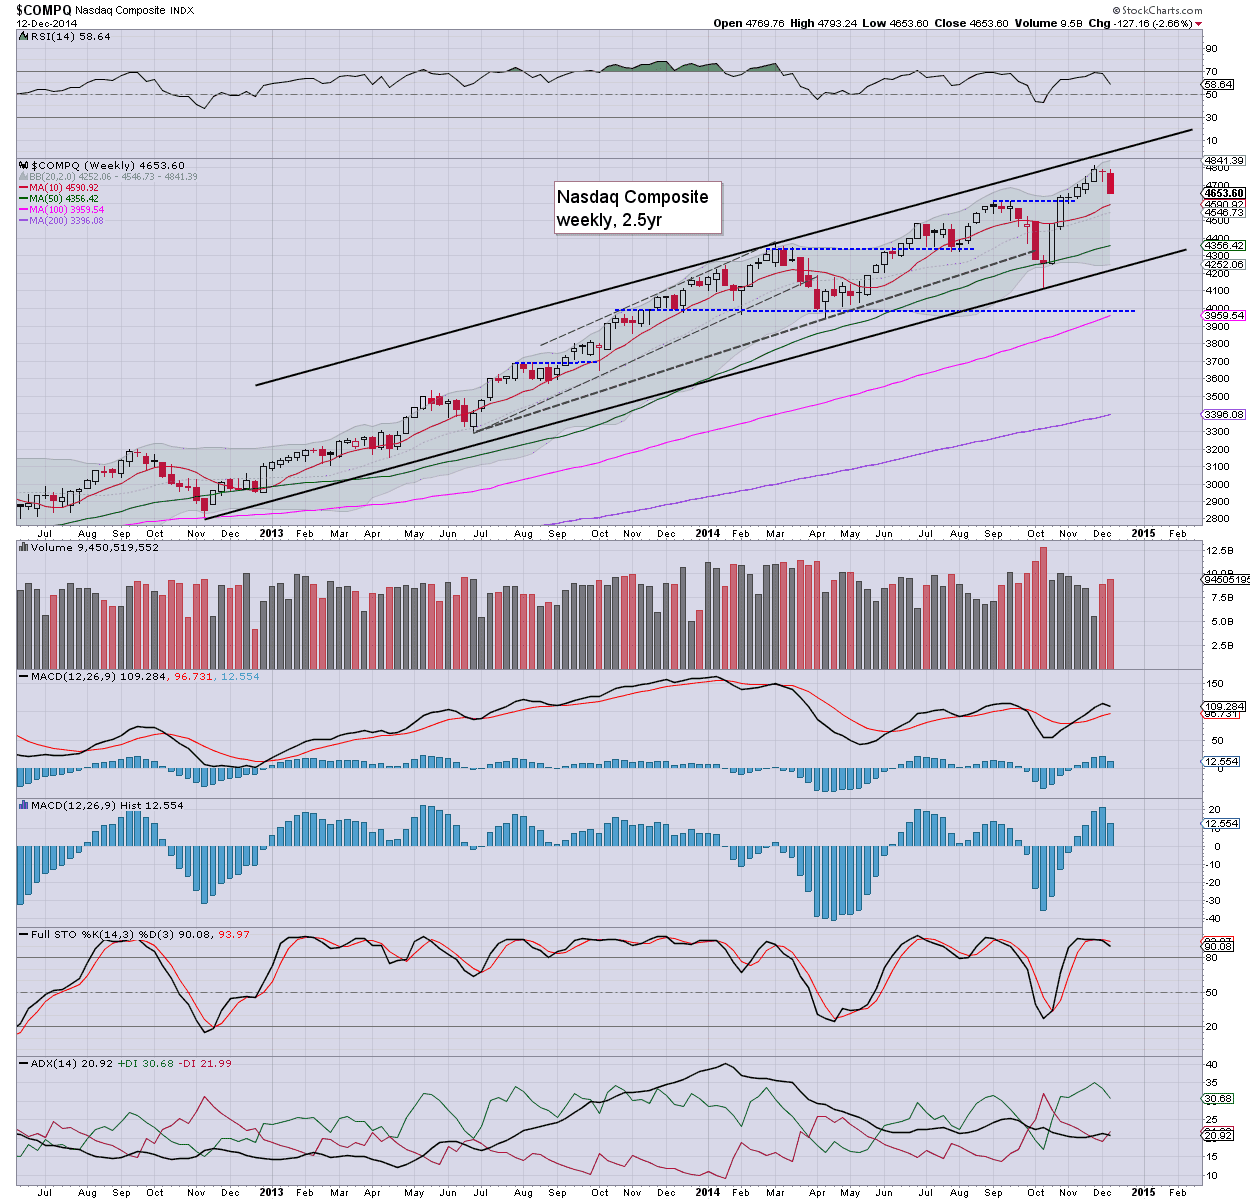
Nasdaq Comp'
The tech declined by -2.7% this week, but considering the hyper-ramp from mid October, this is only a minor retrace. First support is around 4600.. which is about 1.5% lower and could be suggestive of sp'1980.. before the next major multi-week up wave.
Dow
The mighty Dow fell 678pts (-3.8%) this week. Critical support is the big 17k threshold. Unless the equity bears can break under there... this is just a minor retrace of the giant Oct' ramp from 15855.
NYSE Comp'
The master index was especially weak, falling a considerable 469pts (-4.3%) to 10500. Underlying MACD cycle has turned negative. The giant 10k threshold is an obvious level for the equity bears to aim for, but considering the broader market... a 'critical failure' of 10k looks highly unlikely. With the NYSE Comp' back down to 10500 , a yearly close in the 11000s looks overly difficult.
R2K
The second market leader lost 30pts (-2.5%) this week. Interestingly, the R2K is still holding soft support of the 1150 threshold. Breaking a new historic high (>1213) - some 6% higher, is certainly viable by late Jan/early Feb. Any monthly close in the 1220s will signal a massive new up wave is underway, much like the transports in early 2013.
Trans
The 'old leader' lost 315pts (-3.4%). Next soft support is around 8800.. that is just 0.5% lower. The Oct' low is still a clear 1000pts lower.. and does not look in danger of being tested for a very.... very long time.
Summary
So, for most indexes, this was the first net weekly decline since mid October. The size of the declines is pretty impressive - as also reflected in the VIX.. back in the 20s. However, considering the hyper-ramp of sp'1820.. to 2079, this is very likely just a moderate retrace.
Equity bears at best might manage sp'1990/80s in the first half of next week, but it won't likely last. There is very natural cyclical and seasonal factors that are highly suggestive of upside into year end.
With oil prices smashed lower, I'm very much holding to the notion that Mr Market has yet to fully appreciate the positive economic implications for not just the US, but the world economy.
The sp'2100s look a given by late January... and frankly.. I see little reason why the market can't battle higher into late spring... to the 2300s.. and beyond.
Looking ahead
Next week has quite a few things... and is notably, the last full trading week of the year.
M - Empire state, indust' prod, housing market
T - housing starts, PMI manu'
W - CPI... with the weeks big event: FOMC announcement. Market is expecting only a subtle change in policy-statement wording, with the removal of 'extended' in terms of low interest rates. Yellen will have a press conf. shortly after the 2pm announcement.
T - jobless claims, PMI service sector, Phil fed', leading indicators
F - no data, but it will be quad-opex.. so expect some serious price chop.. especially into the weekly close.
--
Audio posting by... yours truly
--
back on Monday :)


