Most of the US indexes climbed for a fourth consecutive week, with the Trans/R2K leading the way, with gains of 2.3% and 1.3% respectively. The exception was the Nasdaq, which slipped a moderate 0.35%. Near term trend remains very much to the upside.
Lets take a look at six of the main US equity indexes
sp'500
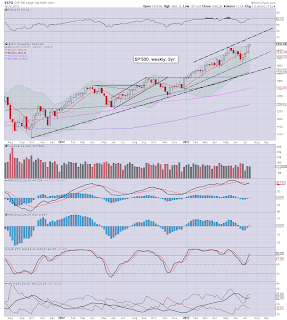
The sp' managed another 0.7%, and the weekly close of 1692 is indeed yet another all time historic daily/weekly closing high. Underlying MACD (blue bar histogram) cycle is now positive again, and we could easily trundle higher for another few weeks.
Bulls should be marginally concerned that we're a mere 3pts from the weekly upper bollinger of 1695. That will jump to the 1700s at the Monday open, so...there is further upside of around 1-2%..- at most, this month.
Nasdaq Comp
The tech' closed the week with a slight decline, but still, the broad trend is upward. Bears need to break back under 3500 to have any hope of a new multi-week down cycle. Best bear case later this Aug/September, is for a fall back down to 3300/3200.
Dow
The Dow managed another 0.5%, although interestingly, the underlying MACD cycle is still moderately negative. A failure for the bulls to advance any further would be somewhat interesting.
Right now, best bear case for late Aug/Sept' is a multi-week down cycle, down to 14750/500. Even 14k now looks out of range for the bears.
NYSE Comp
The master index climbed a rather impressive 1.3% this week, and is now a mere 5% away from hitting the big 10k level. Like the Dow, the NYSE Composite MACD cycle is still negative, but looks set to go positive at the Monday open.
R2K
Once again the R2K is leading the way, and powered 1.3% higher. There is likely resistance in the current area, it will be difficult for the bulls to manage more than another 1-2% higher. Best case downside for September is around 925, but that is a good 10% lower.
Trans
Once again the 'old leader' is leading the way, and ramped 2.3% this week. Underlying MACD cycle is still negative though, and despite the price ramp, there is no bullish cross yet.
Best downside case for Sept' is the 6000 level. The old 5k level now looks impossible to hit at all this year. Indeed, even if we hit 6k within the next 1-2 months, the tranny looks set to close the year in the 7000s..if not 8000s.
Summary
So, that's week'4 up for the QE-fuelled US markets, and there is virtually no sign of weakness out there.
Even (relatively) lousy earnings from MSFT and GOOG were not enough to particularly upset the market on Friday. A year or two ago, such results would have seen the market drop 2% or more. I have no doubt the incessant QE-pomo is helping to nullify any bad news.
Best guess remains unchanged...
sp'weekly8 - mid-term outlook
I am trying to keep an open mind on when the current up wave will max out. It could indeed be as early as next week. On balance though, I'm guessing, more likely the week of July28, if not early August. As ever...one trading day at a time, regardless of any 'best guesses' that I have.
Looking ahead
There isn't much of anything next week, aside from some (arguably) minor housing data. I would suggest the only key econ-data will be Durable Goods orders on Thursday.
*there is significant QE-pomo: mid/large next Tuesday and Thursday.
--
For the bears, this remains a market to avoid. Best case downside for September looks to be no lower than sp'1550/60s..which is where we were just a month ago. Baring an end to the QE-pomo, we'll surely just broadly climb all the way into spring 2014.
Can you imagine how delirious the cheer leading maniacs on clown finance TV will be, when the sp' breaks the big psy' level of 2000 ? After all, as they have always believed, a rising equity market must mean the economy is similarly doing 'better than ever'.
For those not wrapped up in such wilful delusions though, we have some 'interesting' years ahead in this twisted market.
back on Monday


