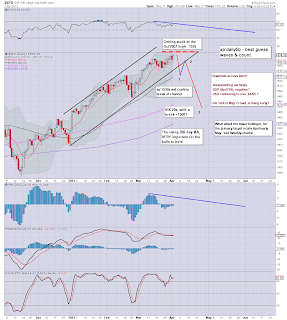
Despite the headline indexes - SP, Dow, Nas, all closing higher, the two indexes which lead the market up... are rolling over, and breaking key rising support. It would seem very likely those more media-focused indexes will follow the Trans and Rus'2000 lower in the days ahead.
sp'daily5b - best guess
sp'weekly2, rainbow
Summary
As detailed in the first chart, is my 'best guess' for the near term. I continue to believe we are putting in a choppy top. A break into the sp'1530s should be enough to confirm what is already happening in the Trans and R2K.
It will also likely be enough to break the key rising support/channel, on the main indexes, and confirm that the big rally from the November low of sp'1343 is...complete.
--
Indeed, despite today's higher highs, the rainbow weekly chart is still sporting a blue candle, the bulls are unlikely to see any green ones for some considerable time! Also, note the MACD (green bar histogram) cycle, which is still rolling over rather nicely.
--
I am short Oil, via USO (option puts), from the 34.70s.
I am seeking a first exit in the low 34s, but primary target is the 31s late April/early May. Wednesday sees the usual EIA (oil) report at 10.30am, and the morning action could be somewhat mixed.
Looking ahead...
We have the ADP jobs data in pre-market. I suppose that might be enough to kick the market another 0.5% higher, but I would just think that makes for an even better re-short level for the bears. We also have ISM data at 10am, which might be enough to upset the market..or at least cut down any opening gap up.
I'm calling it, this multi-month up cycle is about done.
Goodnight from London
---
Video bonus - Biderman
Biderman again notes the issue of the tax year ending next week, which indeed..could lead to some extra sell side volume. We shall see.


