Good morning. Futures have jumped higher, sp +12pts, we're set to open at 1797. Precious metals are choppy, with Gold +$5. Equity bulls look set to break back into the sp'1800s today, but can they hold them? With heavy QE...the bulls have a real chance of closing the weak...net higher!
sp'60min
Summary
*monthly jobs: 203k net gains, headline rate down significantly to 7.0%
--
Notable mover + DRYS +10 cents @ 3.70. The 4s would make things very interesting early next week.
-
For a net weekly gain...bulls need to close +21pts to 1806..that is just about viable...
--
Action in the metals is pretty wild already...Gold has swung from -$12 to +$9. Wild day ahead.
stay tuned!
8.50am.. market..and media starting to get a little hyper.. sp +16pts.. we're set to open at 1801.
Indeed, the notion of a net weekly gain...VERY viable.
8.55am.Fed official Plosser on clown finance TV, he sure is anti-QE, lol. I'm not sure if Mr Market is going to take notice of him right now.
sp +18pts, set to open 1803.
9.09am...media going nuts.. Cramer '..its Cinderella'.
So..the big question is..how we close? Another weekly net gain >1806... a new high. >1812..or...a reversal?
VERY tricky to guess, but with the primary weekly/monthly trends UP..the default reasoning would have to be to the upside.
I can only imagine the horror out there this morning..not least if these gains hold into the weekly close.
9.19am...The daily charts will be offering a confirmed bull flag...if we close in the 1800s..
For the bears..this could be the worse end to the week of the year.. Upside to 1820/30s next week..if we close >1800 today.
-
9.40am.. Well, we're holding 1800..and with a bullish MACD cross on the hourly chart...we could battle higher for the next few days.
There IS a real chance this is just a 'stupid' B wave bounce..but it might not be.
Anyone short/ looking to short...clearly, the short-stop line is around 1810/15.
Friday, 6 December 2013
The good news is bad news situation
Once again we're in the rather crazy situation where Mr Market might interpret the next big jobs number in terms of 'good jobs news..is bad news' - in relation to the continuation of QE. It remains a twisted and bizarre market, and it is a wonder that anyone is involved at all!
sp'weekly8
Summary
It is usually hard to count these waves. As for the above chart, I suppose its possible we're now in sub'4 (blue)...with a likely hit on the rising 10MA in the 1770/50 zone.
Regardless of the micro moves..I'm still holding to the broader upside outlook into early next year, where I would then be looking for a stronger down wave (5-7%) than the current wave (2-4%) - probably to be inspired by the usual debt ceiling/budgetary concerns.
Looking ahead
Tomorrow will of course be all about the monthly jobs data. Market is seeking net gains of 180k, with a slightly lower headline rate of 7.2%.
There is also personal income/outlays, consumer sentiment, and consumer credit.
There are two fed officials on the loose, whose comments might push the market around a bit.
*there is VERY heavy QE of around 4-5bn...bears...beware!
--
Miscellaneous chart of the day
US, 10yr yield, monthly, 15yr overview/outlook
I have to guess we'll eventually hit 4-5% in the current multi-year economic cycle. A peak in late 2015, would match up perfectly with Armstrong's ECM cycle peak in 2015.75.
Doomer bears want good news..for the market to fall, lol
So we're again in the situation where good jobs data might mean the market decides that Fed QE-taper is a little closer. As many have come to accept, the market cares for virtually nothing else, other than its QE liquidity fix/prop...fuel..or whatever you want to call it.
What is my call on the jobs number? Probably >200k, which would likely be enough to make the market seriously wonder if the Fed might taper at the next FOMC of Dec'18. Not that I think that is going to happen, for which I won't get into this night.
It has been a reasonably interesting week, hopefully we'll see some dynamic price action to end the week with a little excitement - even if that is to the upside.
Goodnight from London
Daily Index Cycle update
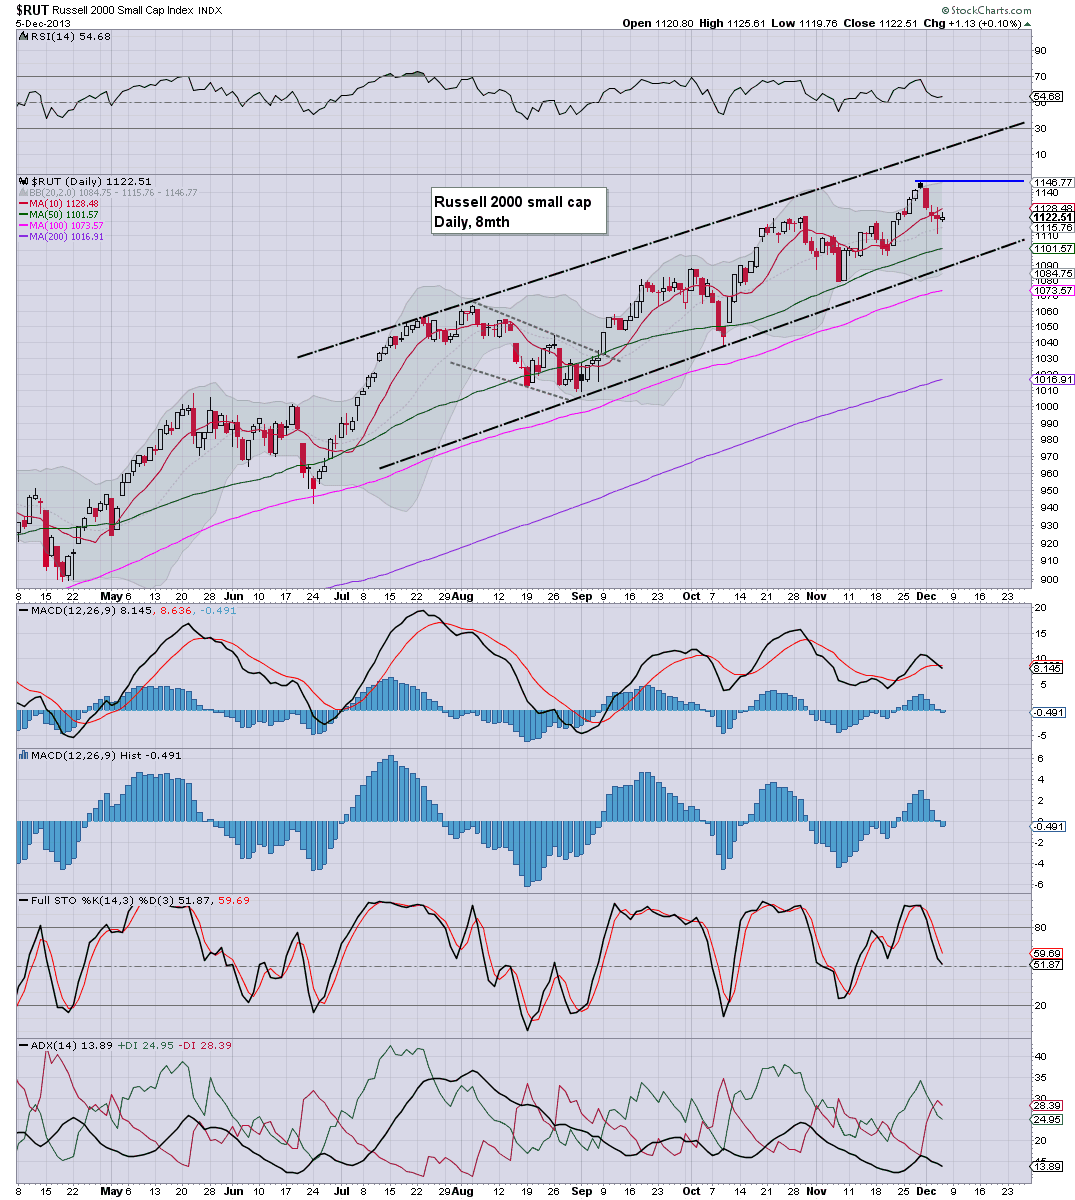
Equity indexes closed moderately weak, with the sp -7pts @ 1785. The two leaders - Trans/R2K, settled flat and +0.1% respectively. Near term outlook is moderately bearish, whilst the broader trend remains to the upside into Jan'2014.
sp'daily
R2K
Trans
Summary
The fifth consecutive decline for the sp'500, although the two leaders were effectively flat on the day.
The near term remains moderately weak, but baring a few daily closes under the old ceiling - which is dow 15800/700 and sp'1760...the trend is clearly to the upside.
Indeed, if bulls can manage a new wave higher within the next few days,,and push higher into end year..the recent weakness was nothing more than a classic back test of the old resistance (now support).
a little more later...
Subscribe to:
Posts (Atom)