We hav an 'inside' day on many of the indexes - and indeed individual stocks.
This is usually a sign of a turn
IWM daily, rainbow chart
Sp, daily, rainbow
NYSE composite, daily, rainbow
Summary
Just look how low the MACD (green bar histogram) cycle is on all 3 charts. We are about as low as we ever go. Considering the '5 waves down' theory looks to have turned out correct, it would appear we've a good likelihood for moving upward all the way into opex next Friday. Yes, there is the real chance of maybe as many as 7-10 'generally' up days. That would really drive the doomer bears nuts.
What now matters is how high can we go? If we get stuck around 1390/1405..that's just no good from a bullish point of view. Bulls need to whack this market up, and break back over 1415..and break a new high - preferably before month end. The next 4 trading days are absolutely critical, and arguably will determine how the next few months proceed.
More later...probably after the close.
Wednesday, 11 April 2012
10am Update
Good morning all.
So, the 'clear 5 waves down' was indeed correct. Now we're getting the up move.
The question is....
Is the bounce a minor wave'2 up (with the 5 waves being a '1')..to be followed by a more severe wave'3...
or....
Is the bounce the first wave of a new major wave higher - which would take us to new highs in late April/May.
My 'best guess' right now would be that we WILL see new highs. The reason is that the style and level of the top doesn't make much sense to me. I could easily be wrong, and we'll soon find out, within the next 3-7 trading days.
Sp'60min
First target would be around 1385/90. A move above 1400 by the Friday close would be a real stretch right now.
VIX'60min
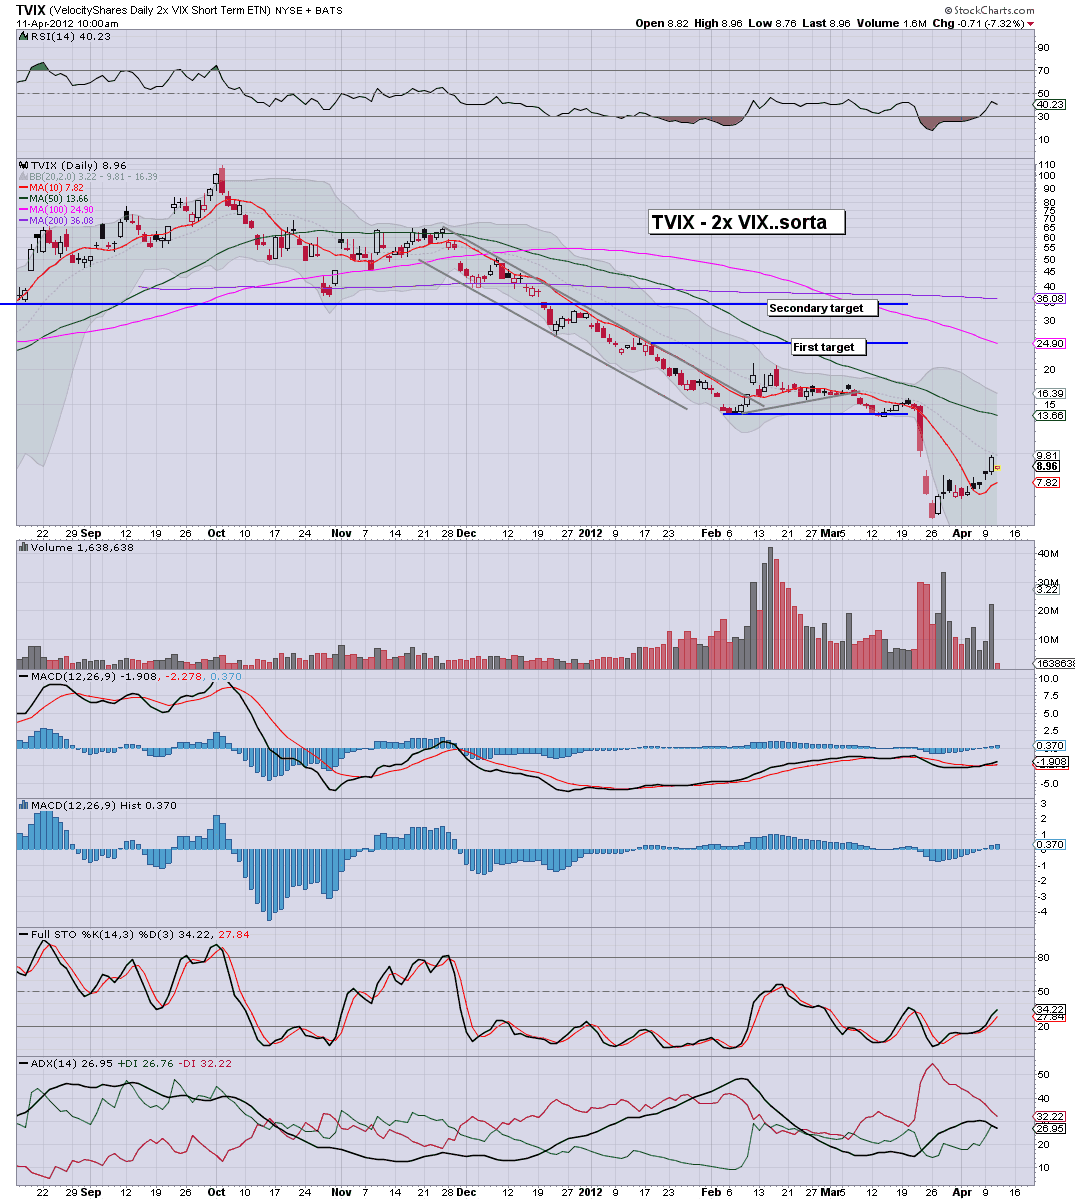
Special note on TVIX
TVIX, daily
They had an opportunity to exit, and rather than exit, I can only imagine just how many were adding to their TVIX positions yesterday. A FAILED ETN, and best left alone!
More later...
So, the 'clear 5 waves down' was indeed correct. Now we're getting the up move.
The question is....
Is the bounce a minor wave'2 up (with the 5 waves being a '1')..to be followed by a more severe wave'3...
or....
Is the bounce the first wave of a new major wave higher - which would take us to new highs in late April/May.
My 'best guess' right now would be that we WILL see new highs. The reason is that the style and level of the top doesn't make much sense to me. I could easily be wrong, and we'll soon find out, within the next 3-7 trading days.
Sp'60min
First target would be around 1385/90. A move above 1400 by the Friday close would be a real stretch right now.
VIX'60min
Special note on TVIX
TVIX, daily
They had an opportunity to exit, and rather than exit, I can only imagine just how many were adding to their TVIX positions yesterday. A FAILED ETN, and best left alone!
More later...
World markets...moving to DEFCON'4
The first 10 days of April have been very eventful, from a monthly cycle perspective. The main 10 world indexes which I now regularly highlight, are all starting to issue initial warnings.
Now, let gets one thing clear before any of the charts. What I believe matters is how we close April, not where we presently are. We could easily cycle back up for the rest of the month, and even close at new highs - although that now seems highly improbable.
So, I will most definitely return to these same charts at the start of May...but for now, lets look where 5 of the 10 indexes (the other 5 are broadly the same anyway)
United Kingdom, monthly, 20yr historic
Spain
Japan
Italy
US, the dow'30
Summary
I won't go through the details of each chart, they largely speak for themselves. What I will note is that...right now...as at April'10, the monthly charts are flashing initial sell signals. We have failures at the 10MA on many, spiky candle tops, and some indexes are close to, or breaking key levels (see Spanish IBEX).
If we close April at these levels, the 7 month up cycle is arguably complete, and a new bearish down wave is beginning. If that is indeed the case by end April, I would strongly believe we'll cycle down to at least sp'1150 within 3-6months.
Tis late...goodnight from London
Now, let gets one thing clear before any of the charts. What I believe matters is how we close April, not where we presently are. We could easily cycle back up for the rest of the month, and even close at new highs - although that now seems highly improbable.
So, I will most definitely return to these same charts at the start of May...but for now, lets look where 5 of the 10 indexes (the other 5 are broadly the same anyway)
United Kingdom, monthly, 20yr historic
Spain
Japan
Italy
US, the dow'30
Summary
I won't go through the details of each chart, they largely speak for themselves. What I will note is that...right now...as at April'10, the monthly charts are flashing initial sell signals. We have failures at the 10MA on many, spiky candle tops, and some indexes are close to, or breaking key levels (see Spanish IBEX).
If we close April at these levels, the 7 month up cycle is arguably complete, and a new bearish down wave is beginning. If that is indeed the case by end April, I would strongly believe we'll cycle down to at least sp'1150 within 3-6months.
Tis late...goodnight from London
Subscribe to:
Posts (Atom)