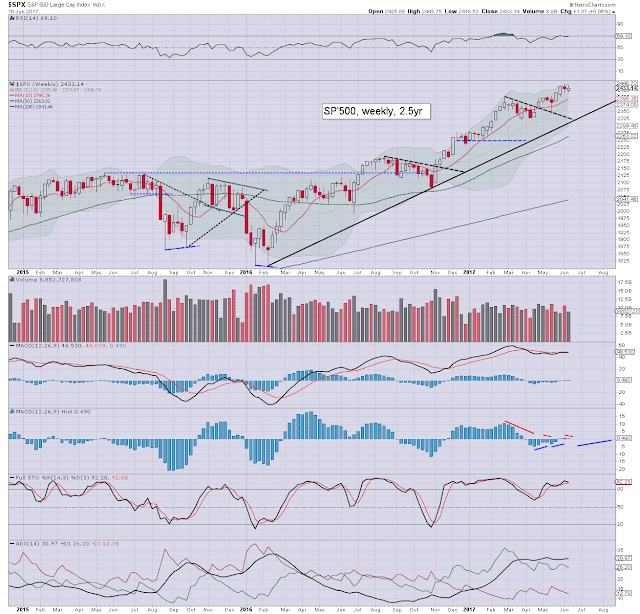
Lets take our regular look at six of the main US indexes
sp'500
A weekly trading range of 25pts (1.0%), settling +1.4pts (0.1%) at 2433. The key 10MA is at 2395, and will offer support around the 2400 threshold next week. Note the rising lower bollinger, currently at 2299, which also intersects with rising trend from Feb'2016.
Best guess: short term weakness to around the 2400 threshold, the 2390s on a stretch, before clawing back upward into July and across the summer. A retrace of around 5% is due in Sept/Oct. Broadly, a year end close in the mid/upper 2600s appears very much within range.
Equity bears have nothing to tout unless a break under multiple aspects of support, currently 2280/300, and rising by around 25pts a month.
--
Nasdaq comp'
The Nasdaq has broadly lead the US market higher, but is clearly seeing some short term weakness, with a second consecutive net weekly decline, settling -0.9% to 6151. It is notable that underlying MACD (blue bar histogram) cycle will turn negative at next Monday's open. The 6K threshold will offer initial support. No price action <5900 can be expected in the near term. The 7000s seem a given before year end.
Dow
The mighty Dow broke a new historic high this week of 21391, settling +0.5% at 21384. A bullish MACD cross is due next week, as the upper bollinger will be offering the 21500s for end June. The 22k threshold is just about within range by end July, but that will clearly require Q2 earnings to come in at least marginally 'better than expected'. The 23000s are a valid target by year end, but that will require no retrace much above >5% in Sept/Oct, and at least one, if not two, more rate hikes.
NYSE comp'
The NYSE comp' broke a new historic high of 11811, climbing for a fourth consecutive week, settling +0.2% at 11772. Underlying MACD has turned positive for the first time since late March.Things only turn bearish if a break <11500 from July onward.
R2K
The second market leader - R2K, was the weakest index this week, settling -1.0% at 1406, but that is just 27pts below last week's historic high. There are a few aspects of support around 1390. Things only turn a little bearish <1360. Underlying MACD cycle remains negative, but price momentum is continuing to claw back toward the zero threshold.
Trans
The 'old leader' - Transports, was the strongest index this week, settling +0.9% at 9414, which is just 2.4% below the historic high of 9639 from February. Underlying MACD is set to turn positive cycle next week, and bodes for the 9600/700s in July/August. The giant 10k threshold looks highly probable by late summer.
--
Summary
All US equity indexes remain within their upward trends that stretch back to early 2016.
The US equity market is still regularly generating new historic highs, usually lead by the Nasdaq.
There is downside buffer of around 5% for most indexes, before core support is at risk of being broken.
--
Looking ahead
There is very little of significance scheduled, and that will give the Mr Market more time to dwell on geo-political issues.
M - -
T - -
W - Existing home sales, EIA Pet' report
T - Weekly jobs, FHFA house price index, leading indict', EIA Nat' gas report
F - New home sales
*there a fair few fed officials on the loose, notably vice-chair Fischer (early Tuesday), and Bullard (Friday).
--
If you value my work, subscribe to me.
Have a good weekend
--
*the next post on this page will likely appear 7pm EST on Monday.


