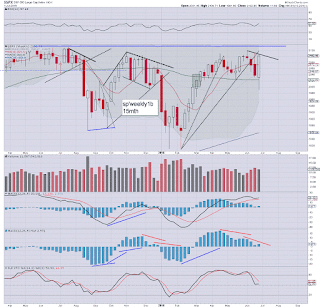
Despite a net weekly gain for the sp'500 of 65pts (3.2%) to 2102, a look across the last year should make it clear... the bull maniacs are still unable to break up and away. There have arguably been seventeen failures since the May 2015 high of sp'2134.
sp'daily1b - failures
sp'weekly1b
Summary
I can understand if you'd dismiss some of the cycle peaks, but we've had at least a clear dozen failures.
Those bull maniacs who still believe we are in a bull market.... err... no.
However, equity bears can't claim we're in a bear market either, as a fair number of the main US indexes remain close to historic highs.
--
re: weekly1b: consider the underlying MACD (blue bar histogram) cycle. The pattern is similar to mid December 2015. If it repeats, next week should close at least moderately net lower, with more powerful downside the week of July 11-15. It is notable that the lower bollinger will be in the 1970/60s next week.
--
Market/Gold chatter from Schiff
--
Thanks for the many comments/emails this week, it is always good to hear from you.
Goodnight from London
--
*the weekend post will appear Sat' at 12pm EST, and will detail the world monthly indexes.

