US equity indexes saw broad gains with net weekly changes ranging from +1.5% (R2K), +0.7% (sp'500), to -0.1% (Transports). Near term outlook is offering renewed downside, as the Greek situation spirals out of control, with EU/Asian markets leading the way lower into the late summer.
Lets take our regular look at six of the main US indexes
sp'500
A net weekly gain of 0.7%. The week started on a down note to 2072, a three day climb to 2126, but then some rather natural weakness into the weekend, settling at 2109.
Underlying MACD (blue bar histogram) cycle ticked higher, but remains negative for the fourth consecutive week. Momentum is now moderately in favour of the bears, but with actual prices close to historic highs.
Best guess... renewed downside to the lower weekly bol', which by end month will be in the 2060s. Sustained action under 2050 looks difficult in the near term.
Nasdaq comp'
A net weekly gain of a significant 1.3%. The tech' finally broke the March 2000 bubble high, with a new historic high of 5143. There is viable downside to the 4800s in the immediate term, which is a clear 4% lower.
Dow
The mighty Dow saw a net gain of 116pts (0.6%), settling @ 18014, a touch below the important 10MA. There is viable downside to the 17700/600s, with rising trend currently in the 17200s. At best, the equity bulls might be able to manage another lunge higher to the 18400/600 zone, but in any case, a sig' correction into the late summer/early autumn to the 16500/000 zone looks probable.
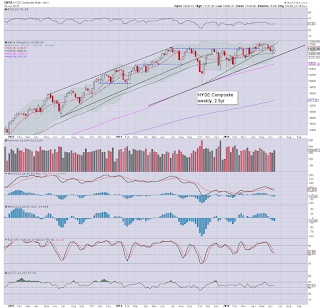
NYSE comp'
The master index saw a minor net weekly gain of around 0.3%, just above the 11k threshold. With the rising trend from Oct' having already been broken, it will be difficult for the NYSE comp' to break back into the 11200s. At best, the 11300s, if the market can somehow magically rally after a Greek default (seemingly likely by early July).
R2K
The second market leader saw a net weekly gain of 1.5%, breaking a new historic high of 1287. First support is now the 1200 psy' level, and then 1150. The Oct' low of 1040 looks extremely difficult to hit. Under no reasonable scenario does sustained price action under 1K look possible this year... or next.
Trans
The 'old leader' - Trans, continues to struggle, with a net weekly decline of -0.1%, settling in the 8400s. Next support is the psy' level of 8K, and then the Oct' low of 7700, the latter of which looks viable by late summer.
Summary
A week for the equity bulls, not least with two new historic highs in the Nasdaq comp' and the R2K. As usual, the Transports continue to lag, and that was despite somewhat weak Oil prices.
Taken as a collective, the broader market trend remains bullish, but is looking increasingly tired. A sig' correction of 8-12% looks very viable for most US indexes across the next 2-4 months.
--
Looking ahead
Next week is likely to be pretty huge...
There is an emergency meeting next Monday (due 1pm EST) between Greece and the various financial groups. The situation remains highly fluid though, and further meetings look probable at some point.
M - existing home sales
T - durable goods orders, PMI manu', new home sales, Richmond fed manu'
W - GDP (rev'2), corp' profits, EIA oil report
T - weekly jobs, pers' income/outlays, PMI serv' sector
F - consumer sentiment.
--
Don't fall in love with the downside
That is what the infamous Mr Carboni will often say (or shout), and I'm still largely in agreement with that sentiment. However, a sig' correction does already appear underway in some of the EU/Asian markets.
In terms of the Dow, the following remains best bearish case...
Dow, weekly'2, with fibs
I want to add, I am still moderately concerned there will be one last push higher in July/August to the 18400/600 zone, before a fast and furious washout in the 16500/000 zone. For now... I am trying to be extra cautious in those bearish trades I do take.
In my view, with each passing week, it becomes increasingly safer to trade on the bearish side.
--
Back at the Monday open :)


