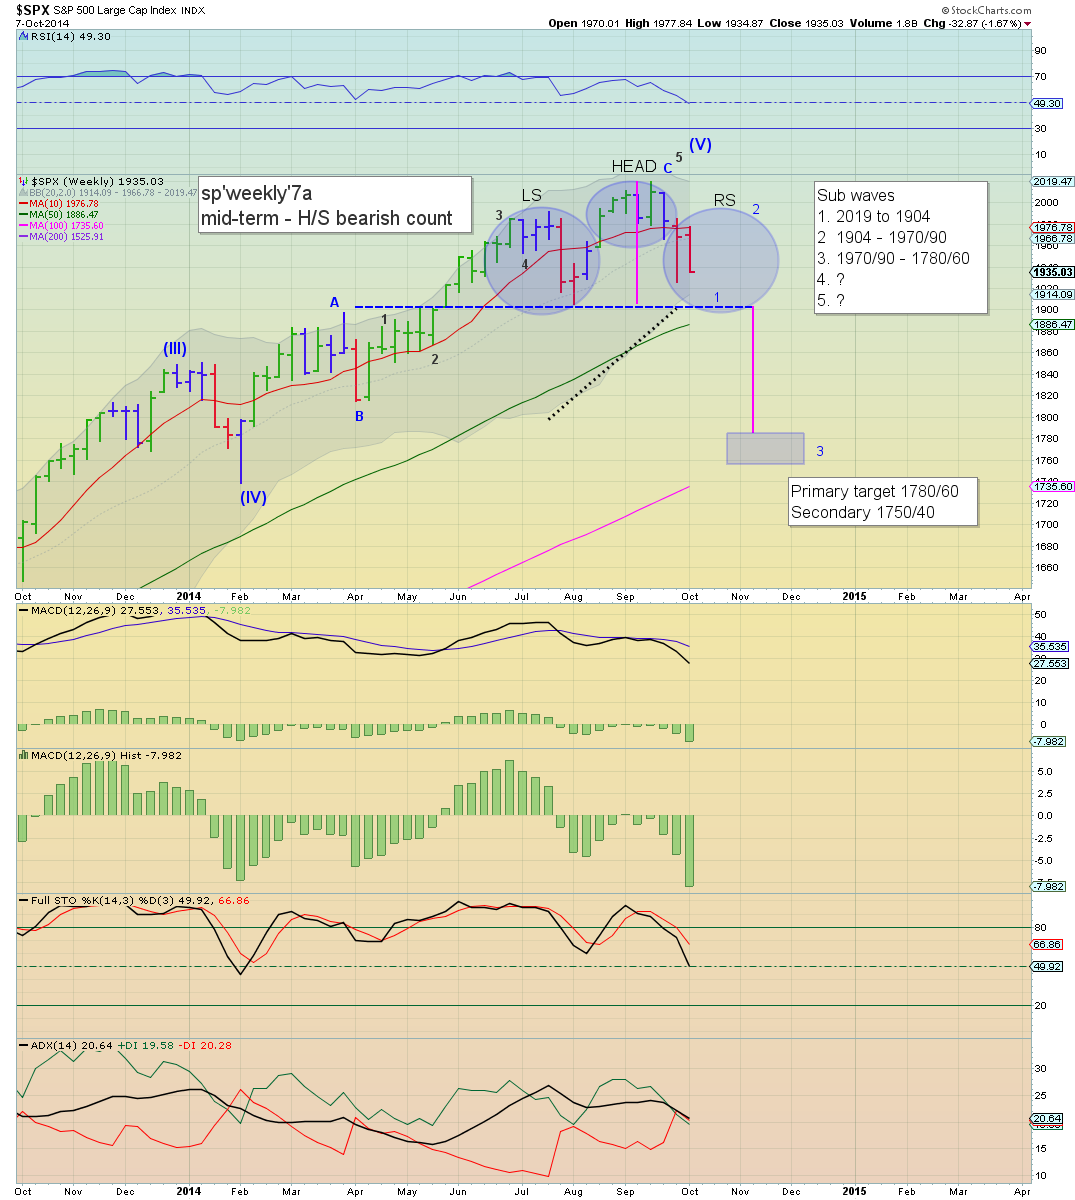
sp'weekly7a
sp'monthly
Summary
So... the weekly 'rainbow' candle remains red... and trend is still suggestive of a hit of the lower weekly bollinger.. in the low 1910s. Certainly though, I don't expect a break under 1900.. with continued downside in the current down cycle.
Seriously... can we break <1900 before year end?
Recent price action has been somewhat bearish, but as ever.. the down waves are still not that consistent.. and the VIX has remained relatively subdued in the teens.
From a trading perspective... late Oct/early Nov... its pretty simple.. if we're stuck in the 1970/90 zone.... I will short with a stop somewhere in the 1990/2000 level. If I'm right about the formation... a blue'3 wave will complete within 9-13 trading days... with downside of around 200pts - roughly 10%.
A fib' retrace of 38% - as happened in summer 2011.. would equate to sp'1650 or so...
--
Closing update from Riley
So.. Riley - like Carboni, and some others are still gunning for the sp'2100s within the next few months.
I'd be in agreement with them, except the monthly charts - not least the R2K and Dow, are already broken, and bode for further weakness... rather than new highs.
--
Looking ahead
The only thing of note tomorrow are the FOMC minutes... but then, I don't expect any surprises in that. No doubt the market will be a bit twitchy ahead of the press release though (2pm).
*next QE is not until next week, and I will be glad to not have to note the figures once QE3 concludes end month.
-
Goodnight from London


