Lets take our regular look at six of the main US indexes
sp'500

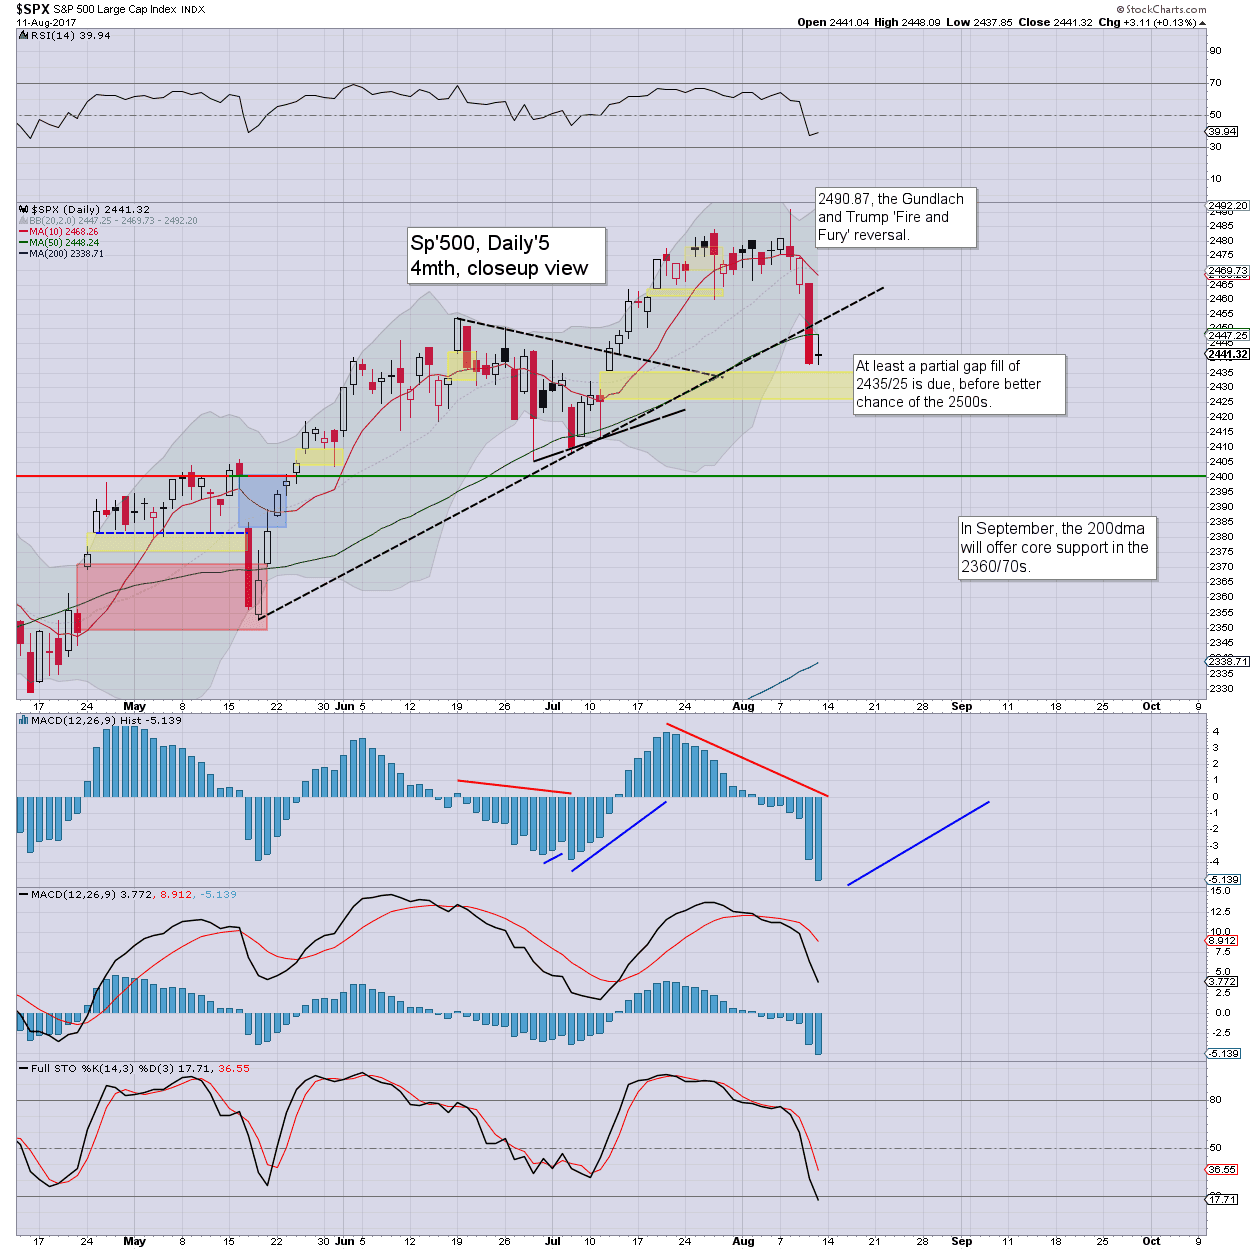
A new historic high of 2490, but swinging lower to 2437. The key 10MA is currently at 2357, which is around the mid term trend that stretches back to the Feb'2016 low of 1810. Underlying MACD (blue bar histogram) cycle is slowly ticking lower, as price momentum is swinging back toward the bears. However, at the current rate, a bearish cross is out of range until at least early October.
Best guess: a brief hit of 2435, and swinging upward to the 2500s into September. A 5% retrace seems probable within Sept-Oct, before another major wave higher. The year end target of 2683 remains on track.
Equity bears have nothing to tout unless a monthly close under the key 10MA, which is notably rising by around 35pts a month.
--
Nasdaq comp'

The Nasdaq has been broadly following the main market, currently net lower for August by -1.4%. The key 10MA, along with rising trend is currently around 5900. Even if the Nasdaq has maxed out for the mid term, a bearish MACD cross looks out of range until early 2018.
Dow

The mighty Dow broke a new historic high of 22179 on Tuesday, and settled the week at 21858. The key 10MA is in the 20700s, and will be around 21k in early September. Price momentum remains powerfully bullish, with an RSI in the 78s. On any basis, that is exceptionally high. Things would only turn mid term bearish with a break <20k, and that looks very unlikely, even if the Korean situation worsened.
NYSE comp'

The master index has notably seen a new historic high of 12019, but settling the week at 11763. Current price action is effectively on rising trend, but still well above the key 10MA (11475). The outlook only turns bearish with a decisive monthly close <11400, but that number is of course rising each month.
R2K

The second market leader - R2K, is the one problem for the equity bull maniacs, having swung from a July historic high of 1452, but currently net lower for August by -3.6% at 1374. The key 10MA is at 1379. Underlying MACD is ticking lower for a fifth consecutive month, as price momentum is increasingly swinging back toward the bears. At the current rate, a bearish cross is possible in September.
An August close at or below current levels, would qualify as an early warning of trouble for the broader equity market. The R2K is just one index of many, but it does merit serious attention.
Trans

The 'old leader' saw a new historic high of 9763 in July, but ended the month bearish. August has begun with relatively minor chop. First soft support is the 10MA, currently at 9196... just 3pts below this weeks close. Rising trend (if you include the lower end spikes) is around 8700. At the current rate, a bearish MACD cross will be due in October.
--
Summary
4 of 6 equity indexes are comfortably holding the mid term trend from early 2016. The NYSE comp' is borderline, whilst the R2K has seen a rather decisive break.
The Sp'500, Dow, and NYSE comp' are still regularly breaking new historic highs, as recently as this past Tuesday.
--
Q. Will the R2K be later seen (in early 2018) as the first 'early warning of trouble'?
Its very possible, but first things first... lets see if the R2K and/or any other indexes can settle August under rising trend, along with the 10MA.
Further, for those seeking a 'grand top' of the rally from spring 2009, other world markets will be absolutely vital for a balanced analysis. Just consider...
Germany, monthly

The DAX is currently net lower for a third consecutive month, but still above the key 10MA. Underlying MACD (green bar histogram) is continuing to tick lower, and a bearish cross is threatened for this October.
Those who believe the US market is at/close to a key multi-year top are going to need to see markets - especially the DAX, break and hold under key supports. Its notable that typically, the EU markets will lead the US.
--
Looking ahead
There is a fair amount of data due, along with some remaining earnings, such as BABA and JD.
However, the market will clearly have particular attention on US-DPRK relations. This past week has seen some pretty fierce war talk from both sides, and if one of the players decides to tip over the chess table, then the market is going to be at least briefly traumatised.
I have heard a fair amount of chatter from mainstream media hacks that markets will quickly rally on 'US military' action, but it negates the underlying issue that North Korea is no Syria, nor Iraq. NK has nuclear weapons, and literally an entire mountain range of artillery weapons pointed at the South Korean capital of Seoul. If things turn 'hot', this is not likely going to end quickly.
M - -
T - Retail sales, Empire State Manu', Import/export prices, Bus' invent', housing mkt' indx
W - Housing starts, EIA Pet' report, FOMC mins (2pm).
T - Weekly jobs, phil' fed, indust' prod', leading indicators
F - Consumer sent' *OPEX*
*the only scheduled fed officials are Kaplan and Kashkari (Thurs/Friday).

Kashkari has been notably against both fed rate hikes this year, and was complaining again on Friday, that weak CPI data supported his notion that the Fed should wait to hike rates. Its pretty incredible that after 8 years, there are still some who believe we should maintain what is an emergency rate of interest.
--
If you value my work, subscribe to me. For $20pcm, I typically provide 500 charts, 40,000 words across 200 posts.
For details: https://permabeardoomster.blogspot.co.uk/p/subscriptions.html

Or you could buy 2 shares of SNAP per month, sometime real soon.
Have a good weekend
--
*the next post on this page will likely appear 6pm EST on Monday.