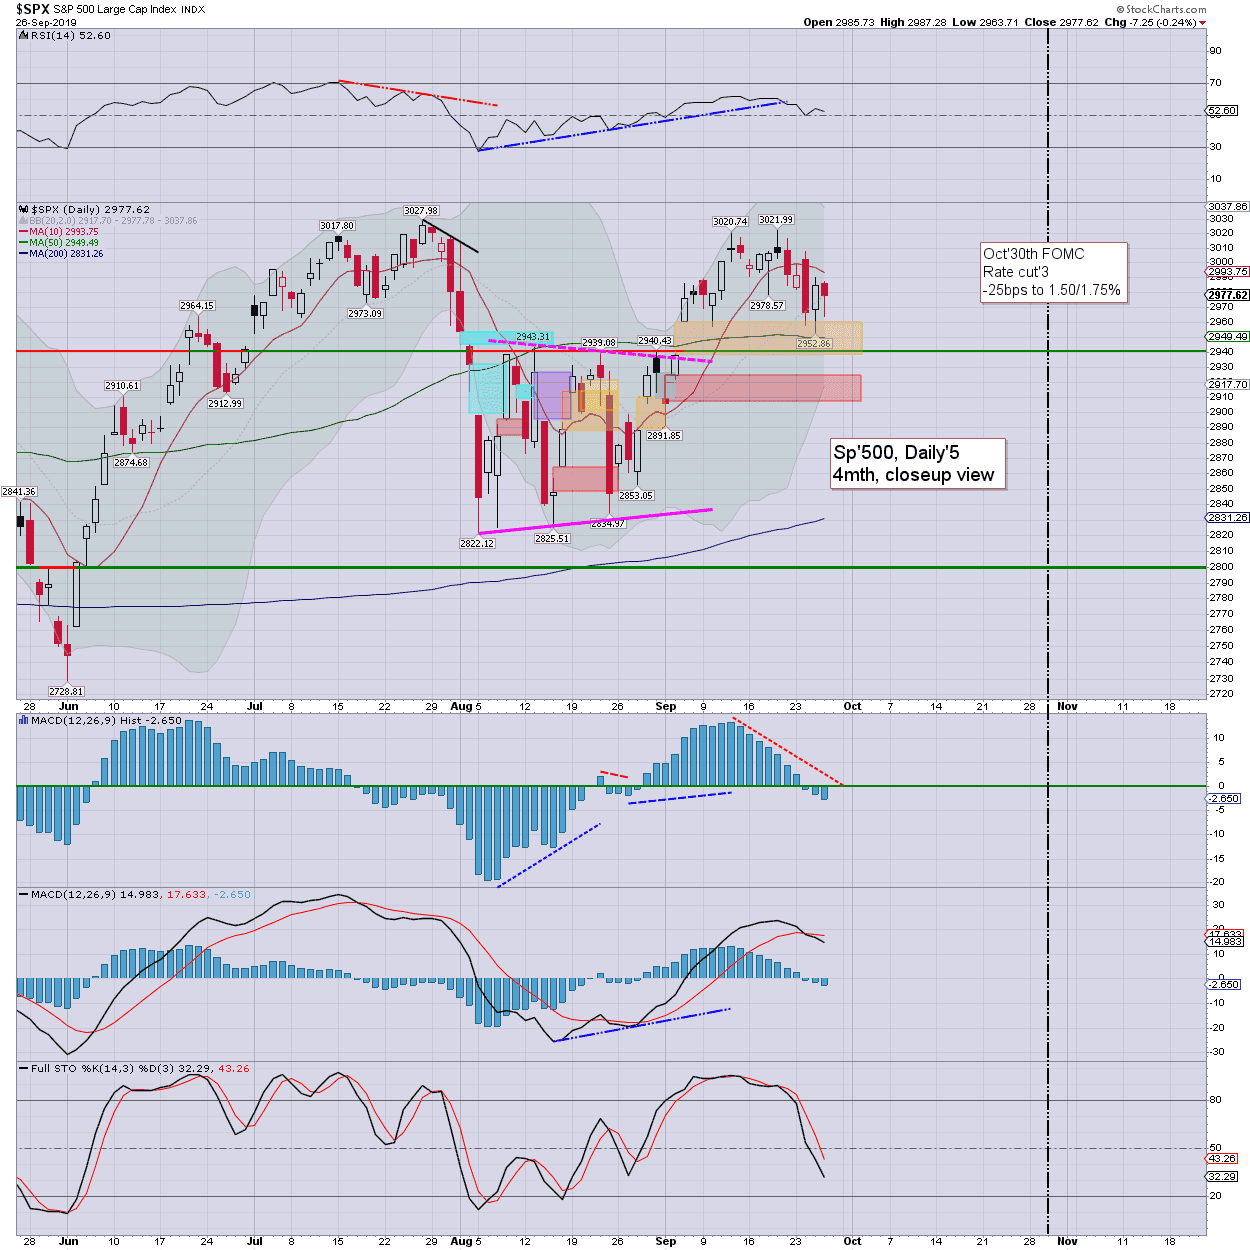
US equity indexes settled September/Q3 on a positive note, sp +14pts (0.5%) at 2976. Nasdaq comp' +0.7%. Dow +0.4%. The two leaders - Trans/R2K, both settled +0.2%.
sp'daily5
VIX'daily3
Summary
US equities ended September/Q3 on a positive note, with the SPX moderately higher by 14pts (0.5%) to 2976. The s/t downward trend remains intact though, as price remains moderately negative.
Volatility was in melt mode, with the VIX settling -5.7% at 16.24. S/t outlook leans to another swing lower, with prime target of the sp'2920s with VIX 19/20.
--
Extra charts in AH (usually around 5pm EDT) @
https://twitter.com/permabear_uk
Goodnight from London
--
If you value my work, subscribe to my intraday service.
For
details and the latest offers, see: permabeardoomster.com
Monday, 30 September 2019
Saturday, 28 September 2019
Weekend update - US equity indexes
It was a bearish week for US equity indexes,
with net weekly declines ranging from -2.5%
(R2K), -2.2% (Nasdaq comp'), -1.1% (Trans), -1.0% (SPX), -0.9% (NYSE comp'), to
-0.4% (Dow). Near term outlook offers another 1-2% of cooling.
Lets take our regular look at six of the main US indexes
sp'500
The SPX cooled for a second consecutive week, -30pt (1.0%) to 2961. Weekly price momentum ticked back lower, and remains fractionally negative. Note the August low of 2822, which is just under the monthly 10MA (2833). Best guess: cooling to the 2920s, but then finding a floor, and resuming upward. Alarm bells if any daily close <2900 and/or VIX >20.00.
--
Nasdaq comp'
A second week lower for tech, settling -178pts (2.2%) to 7939. Note the settlement under the key 10MA, which threatens a test of the August low of 7662. Weekly price momentum ticked back lower, having failed to re-take the key zero threshold.
Dow
The mighty Dow settled -114pts (0.4%) to 26820. Weekly price momentum remained fractionally positive for a second week.
NYSE comp'
The master index cooled for a second week, settling -121pts (0.9%) to 12971. Price structure since February could be argued is a giant H/S formation. Equity bears would need to see at least the 12500s to keep that scenario/structure valid. Like most other indexes, price momentum has stalled at the zero threshold.
R2K
The second market leader settled -39pts (2.5%) to 1520. Weekly price momentum ticked lower, but remains fractionally positive. I would note the four key cycle highs of 1602, 1618, 1599, and 1590.
Note m/t rising trend from Dec'2018, which was broken in early August. We have effectively back-tested the old broken trend, and have resumed lower. Its 'curious', and threatens a serious break under key price threshold of the 1430s. Its something most will have overlooked.
Trans
The 'old leader' - Transports, settled -113pts (1.1%) at 10341. Weekly price momentum ticked lower, but remains fractionally positive. Price structure is rather similar to the R2K, as the US market has been broadly stuck since early 2018.
–
Summary
All six of the US equity indexes saw net weekly declines.
The R2K and Nasdaq lead the way lower, with the Dow most resilient.
More broadly, all six indexes are currently above their respective monthly 10MA.
YTD price performance:
The Nasdaq comp' continues to lead for the year, currently +19.7%. The SPX is +18.1%, the Dow +15.0%, with the NYSE comp' +14.0%. The Transports are +12.8%, and the R2K +12.7%.
--
Looking ahead
Earnings: LEN, BBBY (Wed'), PEP, STZ (Thurs').
Econ-data:
M - Chicago PMI
T - PMI/ISM manu', construction
W - Vehicle sales, ADP jobs, EIA Pet'
T - Weekly jobs, PMI/ISM serv', factory orders
F - Monthly jobs, intl' trade
*Monday will be end month/Q3. I would expect higher volume, with more dynamic price action.
--
Final note
Whilst the s/t outlook offers a little further cooling, it should be clear, the US equity market and economy is still pretty strong. All the main indexes are holding m/t bullish trends.
Just so there is no misunderstanding...
SPX, monthly'5, fib' levels
First, the current m/t trend IS bullish. That would arguably only change with a monthly settlement under the key 10MA, currently at 2833.
Note the next giant Fibonacci extrapolation of 3047. If we break above that, then I would have to seek far higher levels in 2020/21, arguably to at least 3900/4000. Whilst that might sound crazy, the crazy train does already have some passengers...
If we do break above 3047, Lee's hyper bullish call will have to be seen as one of the best market calls in some years.
Arguing against such upside are the bond and precious metals markets. Those signals would only be negated if the US 10yr >2.25%, and Gold <$1370s. Neither of those appear likely before year end. As ever, one day at a time.
If you value my work on Blogger and Twitter, subscribe to me.
For details/latest offers, see: Permabeardoomster.com
Have a good weekend
--
*the next post on this page will likely appear 5pm EDT on Monday.
Lets take our regular look at six of the main US indexes
sp'500
The SPX cooled for a second consecutive week, -30pt (1.0%) to 2961. Weekly price momentum ticked back lower, and remains fractionally negative. Note the August low of 2822, which is just under the monthly 10MA (2833). Best guess: cooling to the 2920s, but then finding a floor, and resuming upward. Alarm bells if any daily close <2900 and/or VIX >20.00.
--
Nasdaq comp'
A second week lower for tech, settling -178pts (2.2%) to 7939. Note the settlement under the key 10MA, which threatens a test of the August low of 7662. Weekly price momentum ticked back lower, having failed to re-take the key zero threshold.
Dow
The mighty Dow settled -114pts (0.4%) to 26820. Weekly price momentum remained fractionally positive for a second week.
NYSE comp'
The master index cooled for a second week, settling -121pts (0.9%) to 12971. Price structure since February could be argued is a giant H/S formation. Equity bears would need to see at least the 12500s to keep that scenario/structure valid. Like most other indexes, price momentum has stalled at the zero threshold.
R2K
The second market leader settled -39pts (2.5%) to 1520. Weekly price momentum ticked lower, but remains fractionally positive. I would note the four key cycle highs of 1602, 1618, 1599, and 1590.
Note m/t rising trend from Dec'2018, which was broken in early August. We have effectively back-tested the old broken trend, and have resumed lower. Its 'curious', and threatens a serious break under key price threshold of the 1430s. Its something most will have overlooked.
Trans
The 'old leader' - Transports, settled -113pts (1.1%) at 10341. Weekly price momentum ticked lower, but remains fractionally positive. Price structure is rather similar to the R2K, as the US market has been broadly stuck since early 2018.
–
Summary
All six of the US equity indexes saw net weekly declines.
The R2K and Nasdaq lead the way lower, with the Dow most resilient.
More broadly, all six indexes are currently above their respective monthly 10MA.
YTD price performance:
The Nasdaq comp' continues to lead for the year, currently +19.7%. The SPX is +18.1%, the Dow +15.0%, with the NYSE comp' +14.0%. The Transports are +12.8%, and the R2K +12.7%.
--
Looking ahead
Earnings: LEN, BBBY (Wed'), PEP, STZ (Thurs').
Econ-data:
M - Chicago PMI
T - PMI/ISM manu', construction
W - Vehicle sales, ADP jobs, EIA Pet'
T - Weekly jobs, PMI/ISM serv', factory orders
F - Monthly jobs, intl' trade
*Monday will be end month/Q3. I would expect higher volume, with more dynamic price action.
--
Final note
Whilst the s/t outlook offers a little further cooling, it should be clear, the US equity market and economy is still pretty strong. All the main indexes are holding m/t bullish trends.
Just so there is no misunderstanding...
SPX, monthly'5, fib' levels
First, the current m/t trend IS bullish. That would arguably only change with a monthly settlement under the key 10MA, currently at 2833.
Note the next giant Fibonacci extrapolation of 3047. If we break above that, then I would have to seek far higher levels in 2020/21, arguably to at least 3900/4000. Whilst that might sound crazy, the crazy train does already have some passengers...
If we do break above 3047, Lee's hyper bullish call will have to be seen as one of the best market calls in some years.
Arguing against such upside are the bond and precious metals markets. Those signals would only be negated if the US 10yr >2.25%, and Gold <$1370s. Neither of those appear likely before year end. As ever, one day at a time.
If you value my work on Blogger and Twitter, subscribe to me.
For details/latest offers, see: Permabeardoomster.com
Have a good weekend
--
*the next post on this page will likely appear 5pm EDT on Monday.
Thursday, 26 September 2019
More failing garbage
US equity indexes closed on a weak note, sp -7pts (0.2%) at 2977. Nasdaq comp' -0.6%. Dow -0.3%. The two leaders - Trans/R2K, settled -0.2% and -1.1% respectively.
sp'daily5
VIX'daily3
Summary
US equities opened in minor chop mode, and soon leaned a little weak. With the early pricing for Peloton IPO offering $26/25s, the market turned moderately lower to 2963. There was yet another latter day recovery to turn fractionally positive in the closing hour, but settling -7pts to 2977.
Volatility saw a mixed day, with the VIX printing a high of 17.09, and settling +0.7% at 16.07. S/t outlook favours further equity cooling to the sp'2920s, which would arguably sync with VIX 19/20s.
More failing garbage
The cheerleaders were naturally rather pleased with the opening bell at the Nasdaq...
Peloton (PTON) eventually opened at $27.00, saw an early high of $27.98, a closing hour low of $24.75, with a micro rally to settle -11.2% at $25.76.
1min candle chart
On any basis... it was a gross failure, with most other recently listed stocks - such as SDC, CHWY, and NET, similarly getting the smack down.
It is the case that Mr Market is increasingly intolerant of tier'1 loss making corporate garbage. This is perhaps one of the healthiest signs we've seen in some years. We actually have a market that is discriminating against newly listed companies that don't turn a profit.
--
--
Extra charts in AH (usually around 5pm EDT) @ https://twitter.com/permabear_uk
Goodnight from London
--
If you value my work, subscribe to my intraday service.
For details and the latest offers, see: permabeardoomster.com
sp'daily5
VIX'daily3
Summary
US equities opened in minor chop mode, and soon leaned a little weak. With the early pricing for Peloton IPO offering $26/25s, the market turned moderately lower to 2963. There was yet another latter day recovery to turn fractionally positive in the closing hour, but settling -7pts to 2977.
Volatility saw a mixed day, with the VIX printing a high of 17.09, and settling +0.7% at 16.07. S/t outlook favours further equity cooling to the sp'2920s, which would arguably sync with VIX 19/20s.
More failing garbage
The cheerleaders were naturally rather pleased with the opening bell at the Nasdaq...
Peloton (PTON) eventually opened at $27.00, saw an early high of $27.98, a closing hour low of $24.75, with a micro rally to settle -11.2% at $25.76.
1min candle chart
On any basis... it was a gross failure, with most other recently listed stocks - such as SDC, CHWY, and NET, similarly getting the smack down.
It is the case that Mr Market is increasingly intolerant of tier'1 loss making corporate garbage. This is perhaps one of the healthiest signs we've seen in some years. We actually have a market that is discriminating against newly listed companies that don't turn a profit.
![]() |
| Garbage! |
![]() |
| Darkening skies |
Extra charts in AH (usually around 5pm EDT) @ https://twitter.com/permabear_uk
Goodnight from London
--
If you value my work, subscribe to my intraday service.
For details and the latest offers, see: permabeardoomster.com
Subscribe to:
Posts (Atom)