The year ended on a very bearish note, with net monthly changes ranging from -10.8% (Russia), -1.7% (USA - Dow), to +2.7% (China). Net yearly changes ranged from -23.6% (Greece), -2.2% (USA - Dow), to +9.6% (Germany). Price action/structure is increasingly leaning toward the equity bears.
Lets take our monthly look at ten of the world equity markets
Greece
A fierce net yearly decline of -23.6%, settling @ 631. For December, a net decline of -0.5%, offering a vain attempt to put in a spike floor from 557. The 2012 low of 471 will likely be broken under, as the Greek economy remains in collapse mode.
Brazil
A net yearly decline of -13.3%, settling @ 43349. A Dec' net decline of -3.9%. Any break <41k would offer a straight run to 30K.. back to the 2008 low.
France
A net yearly gain of 8.5%, having got stuck at resistance of 5283 in April. A Dec' net decline of -3.9%. Those who remain broadly bullish world equities should be desperately seeking a CAC monthly close in the 5300s by early summer.
Germany
The economic powerhouse of the EU - Germany, saw a net yearly gain of 9.6%, settling @ 10748. The year ended with a very significant December net decline of -5.6%. It is notable that the DAX is back under the 10MA, and overall price structure from the Aug' low could be argued is a large bear flag. Core support in 2016 will be the old double top of 2000/2008, around the 8K threshold.
UK
A net yearly decline of -4.9%, having peaked in April @ 7122, and still unable to attain a monthly close above the psy' level of 7K. Ending the year with a Dec' net decline of -1.8%. First support will be the 5600/500 zone. After that, 5K.
Spain
Remaining the most problematic of the EU-PIIGS, Spain saw a net yearly decline of -8.0%, having maxed out in April @ 11884. Resistance around 12K remains extremely powerful. The year ended with a Dec' net decline of -8.1%. Price structure is a multi-month bear flag, sustainably under the 10MA. Next downside target is the 8000/7500 zone.
USA - Dow
The mighty Dow saw a net yearly decline of -2.2%, having peaked in May @ 18351, and then cooling to an Aug' low of 15370. The year ended on a somewhat negative note, with a net Dec' decline of -1.7%, settling @ 17425.
Underlying MACD (green bar histogram) cycle remains negative, and is threatening to start ticking lower again. At the current rate of decline, the MACD (black line) will turn negative in April/May. The last time that happened was Sept' 2008.
First downside target is the 16300/000 zone. Any monthly closes <16K would bode for the Aug' lows to be broken. From there, next support would be the Oct'2007 high of 14198, and then 13K.
As things are, unless the Dow can attain a Jan/Feb' close >17500, the default trade is now to the short side.
Japan
The BoJ fuelled Nikkei saw a net yearly gain of 9.1%, having peaked in June at 20952, and then cooling to a Sept' low of 16901. The year ended on a very negative note, with a Dec' net decline of -3.6%, settling @ 19033. First downside target is the 17000/16500 zone. After that, 15k, and 12k.
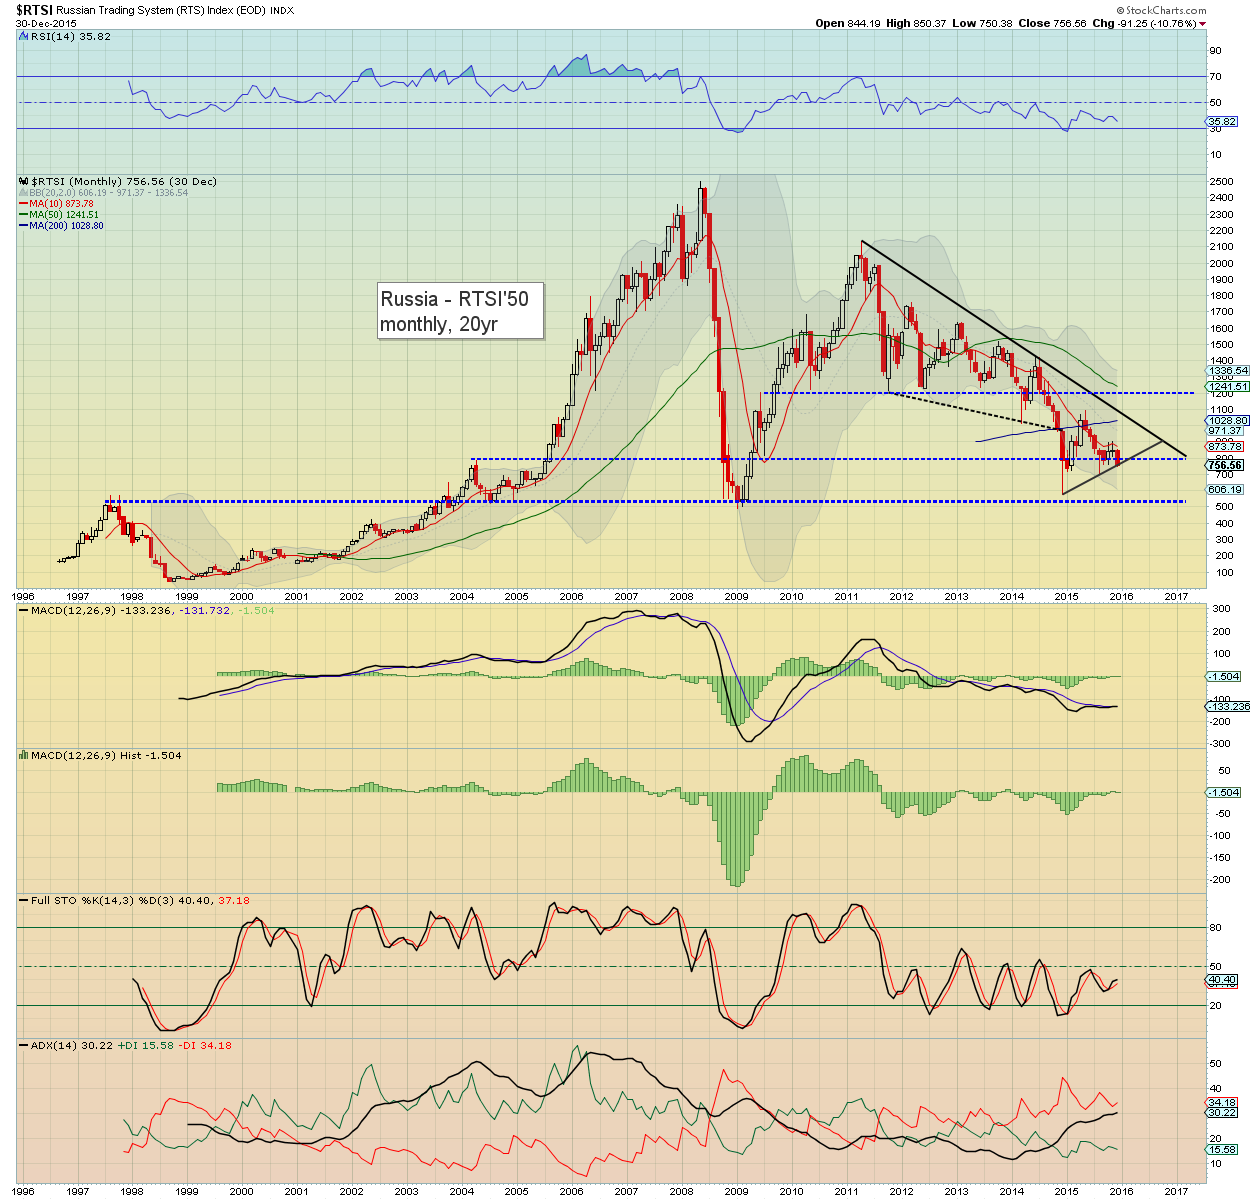
Russia
The Russian market declined for the fifth consecutive year, with a net decline of -3.8%. The year ended on a deeply bearish note, with a net Dec' decline of -10.8%, settling @ 756. With energy prices set to remain broadly low across 2016, the Russian market looks highly vulnerable to testing the 2009 low of 492.
China
The Shanghai comp' saw a roller coaster year, peaking in June @ 5178, but then crashing to an Aug' low of 2850. With three consecutive net monthly gains (Dec' net gain, +2.7%) into year end, this resulted in a net yearly gain of 9.4%, settling @ 3539.
Like many other indexes though, price structure could be argued is a bear flag from Aug-Dec. Equity bears should be seeking a Jan/Feb close under the very important 3400 threshold. In any sig' down wave, key supports are 2500, 2000, and the 1600s.
No doubt, the Chinese leadership will launch further witch hunts in 2016, and that sure won't help inspire capital not to attempt an escape from such communistic rule.
Summary
A few things should be clear...
-The EU indexes peaked April/May, and were the early warning for broader global equity weakness in Aug/Sept'.
-Germany and Japan were especially helped via ECB/BoJ QE support.
-The commodity dependent BRICs of Brazil, Russia, and China were greatly impacted.
-Price structure on most world markets is a bear flag that stretches from the Aug/Sept' low to the Dec' peak.
-The year ended on a very bearish note, with 9 of 10 markets seeing net Dec' declines.
Equity bulls should be desperate to see indexes retake their respective 10MAs, and negate the flag with the positive January.
All equity bears need to achieve is a marginal Jan' decline, and if that is the case, a major wave lower - at least to the Aug' lows, will likely occur within the March/May period.
--
Looking ahead
The week will be focused on the next big jobs data, along with renewed interest in the chatter at PRINT HQ.
M - PMI/ISM manu', construction
T - vehicle sales
W - ADP jobs, intl' trade, PMI/ISM serv' sector, factory orders, EIA report.
*the FOMC mins' will be released at 2pm, and Mr Market will be especially looking for any chatter on normalising rates across 2016.
T - weekly jobs
F - monthly jobs, consumer credit, wholesale trade.
*Fed official Evans will be speaking on the economy on Thursday afternoon.
--
The outlook for 2016
Along with my own outlook, I will post YOUR predictions for 2016 on Monday evening.
Indeed, it is not too late to submit your best guess/comments.. see
HERE for details.
-
Enjoy the holiday weekend, I'll be back on Monday :)