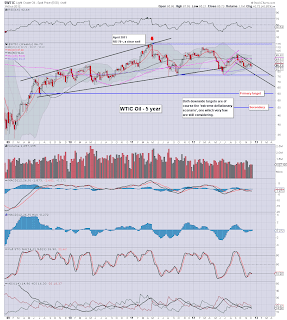
Despite the regular bouts of money printing from the various central banks, deflation still appears the more powerful force. WTIC Oil remains in a bearish formation on the daily and weekly charts, and $77/75 seems very viable in January
WTIC Oil, daily
WTIC Oil, weekly
WTIC Oil, monthly2, rainbow
Summary
The daily and weekly charts are especially bearish, it would not surprise me if $80 is tested and briefly broken through next week.
The weekly chart easily supports the notion of WTIC Oil back in the mid 70s early next year. If we do see a few daily closes under the June $77 low, I'd expect my primary target of $60 to be hit 'sometime in 2013'.
It will take a serious recession in 2013 to get Oil back to the $50 level - not seen since May 2009. Yet, we have the biggest set of tax rises and spending cuts - via the fiscal cliff measures, due in a mere 17 days. Unless an agreement is reached to fully delay ALL measures, GDP is going to take a major hit in the first half of 2013.
Where is the inflation?
For those still expecting hyperinflation to occur in the near term, they really need to take a long look at the Oil charts, which are indeed warning of nothing less than a second deflationary wave. It probably won't be as severe as the one seen across 2008/9, but it will certainly keep prices pressed to the downside.
Goodnight from London
--
*next post, late Saturday, covering the weekly US index cycles.


